At 1:04 PM EDT today, a hen-egg-sized hailstone — 2.00 inches in diameter — struck 1 NW Clarendon Hills in DuPage County, Illinois. By 2:53 PM, less than two hours later, THOR Storm Mapper had already logged the event, drawn the outbreak polygon, and was displaying a full county-level impact summary in real time. The storm was still active when these screenshots were taken.
This is what sub-hour hail intelligence looks like in practice.
The Storm System: A Great Lakes Outbreak
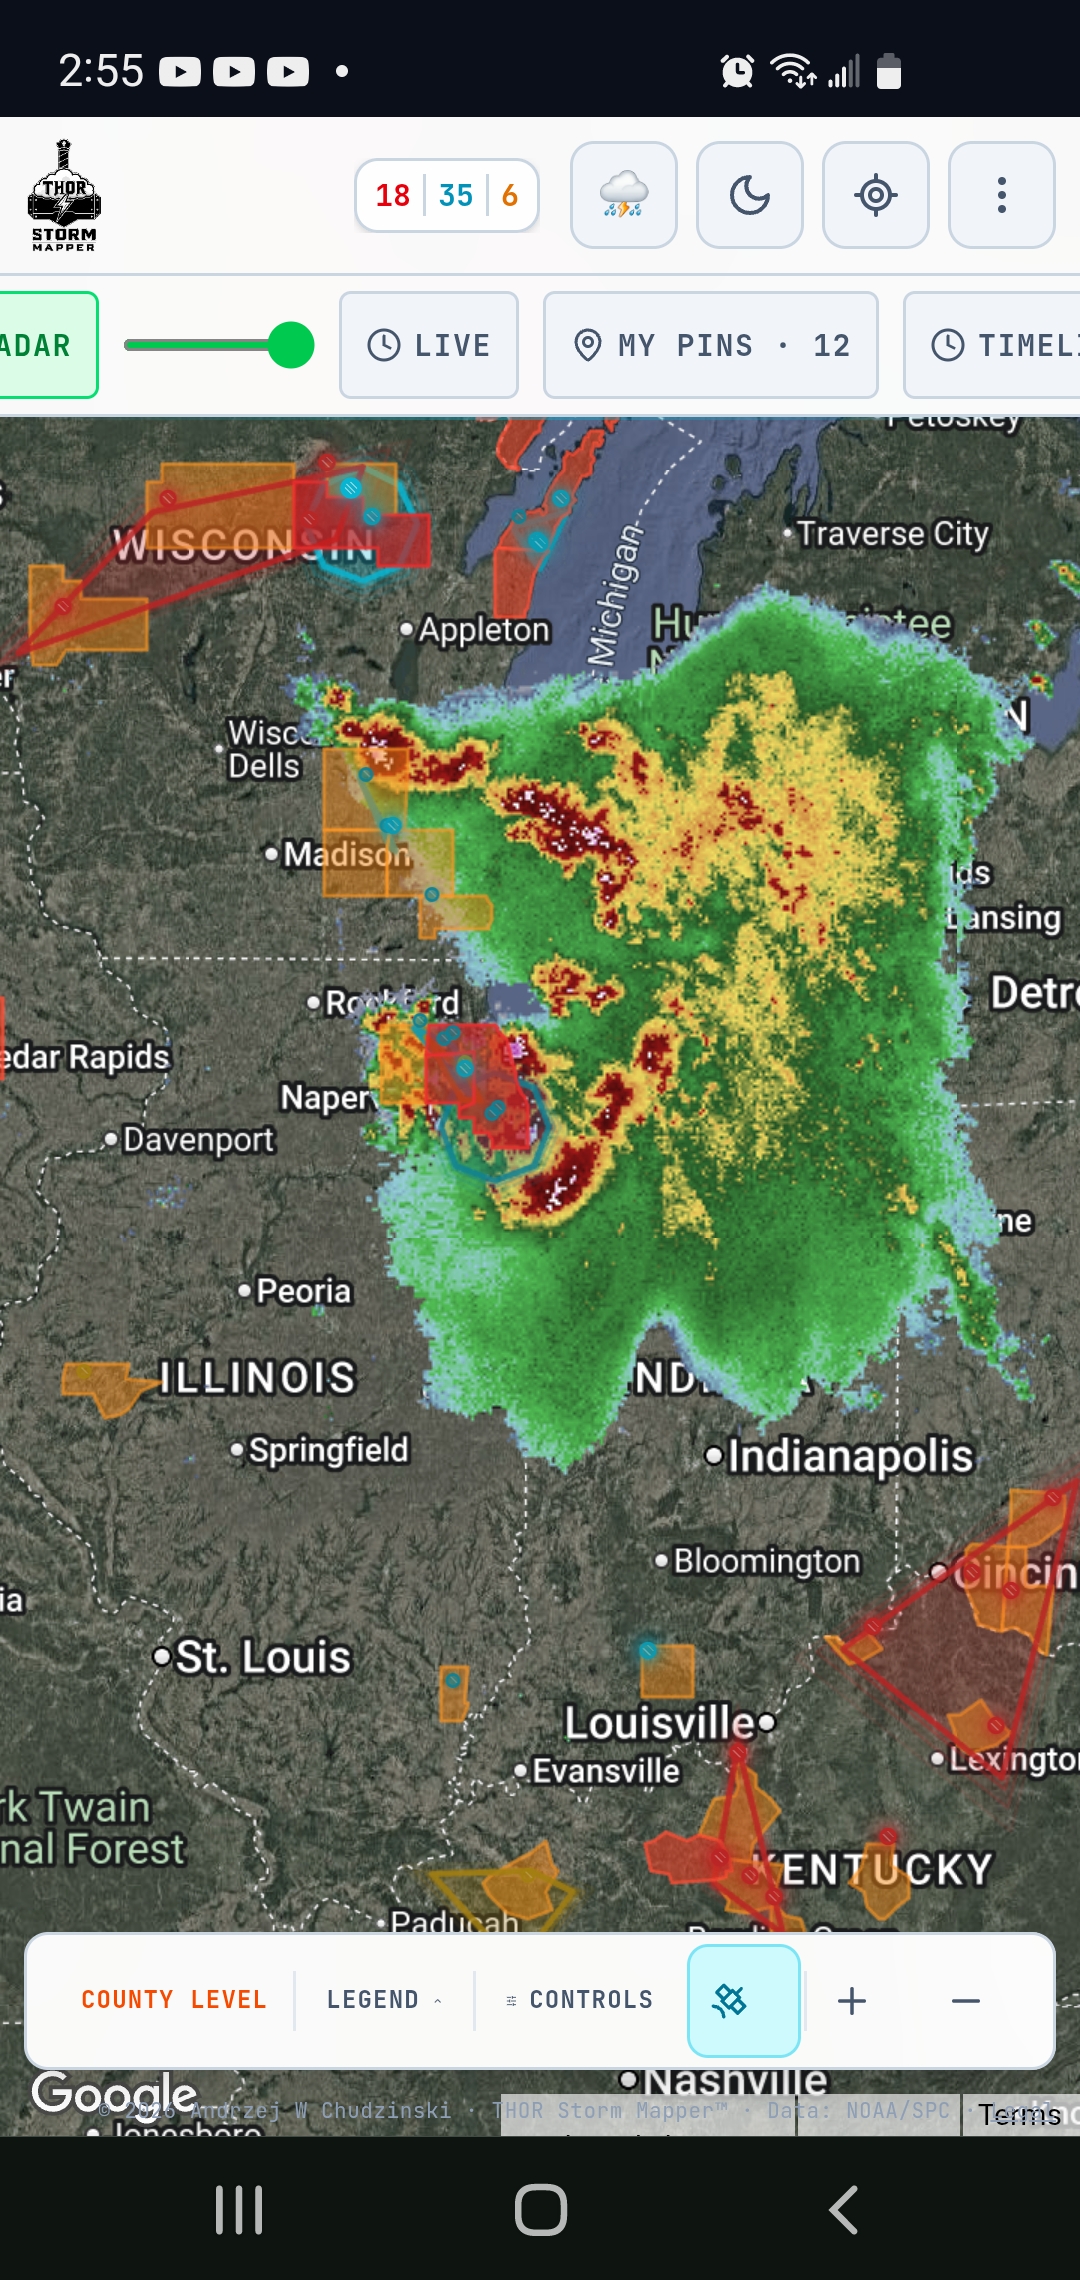
The wide-view radar capture at 2:55 PM tells the full scale of the event. A massive multi-cell storm complex stretched from Wisconsin across northern Illinois and into Michigan, with intense red and dark red reflectivity cores visible over the Rockford and Naperville corridors. The system header showed 18 tornado reports, 35 hail reports, and 6 wind reports active across the region — a significant outbreak by any measure.
The DuPage County Impact: By the Numbers
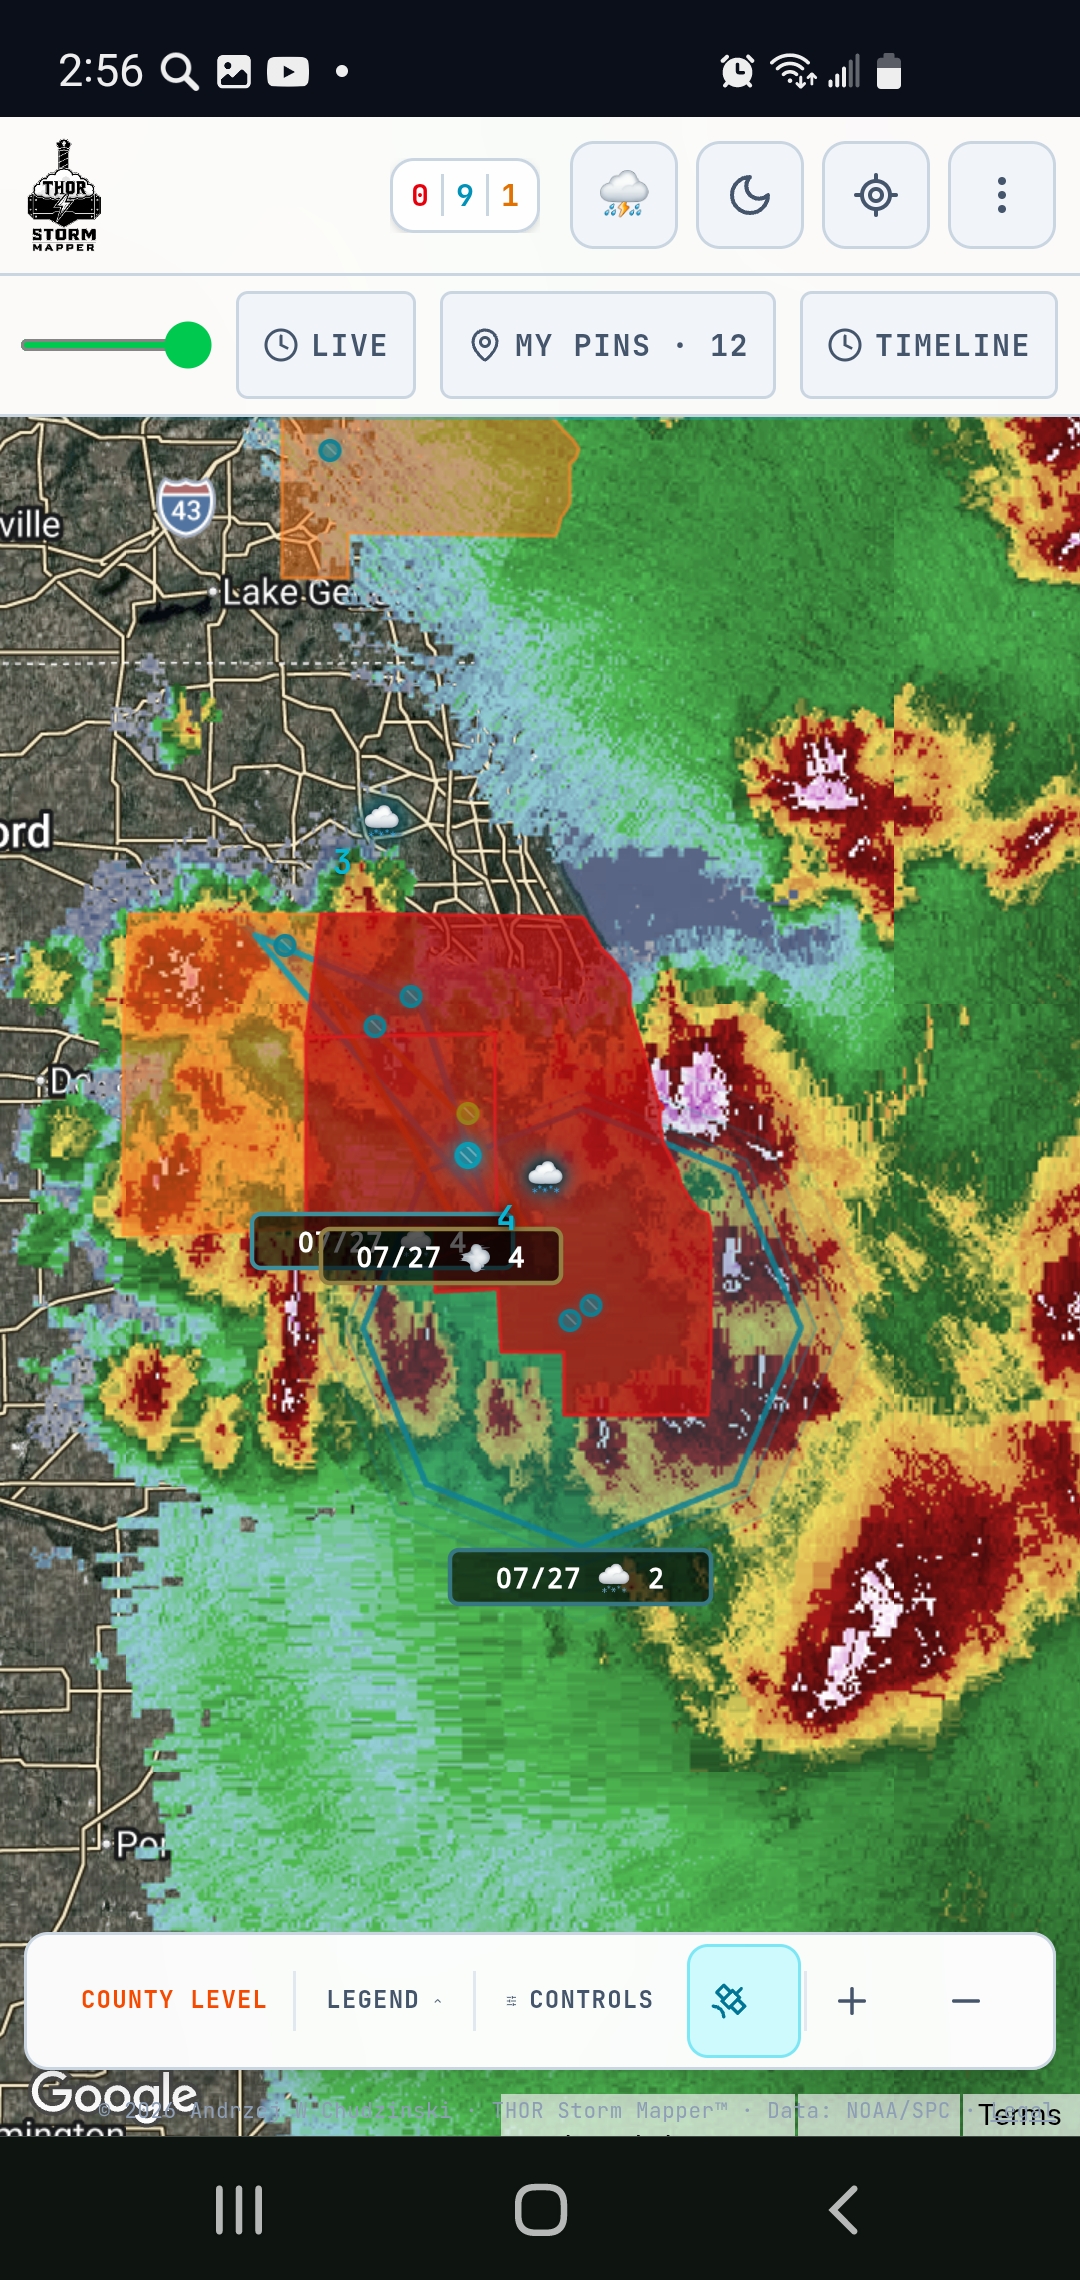
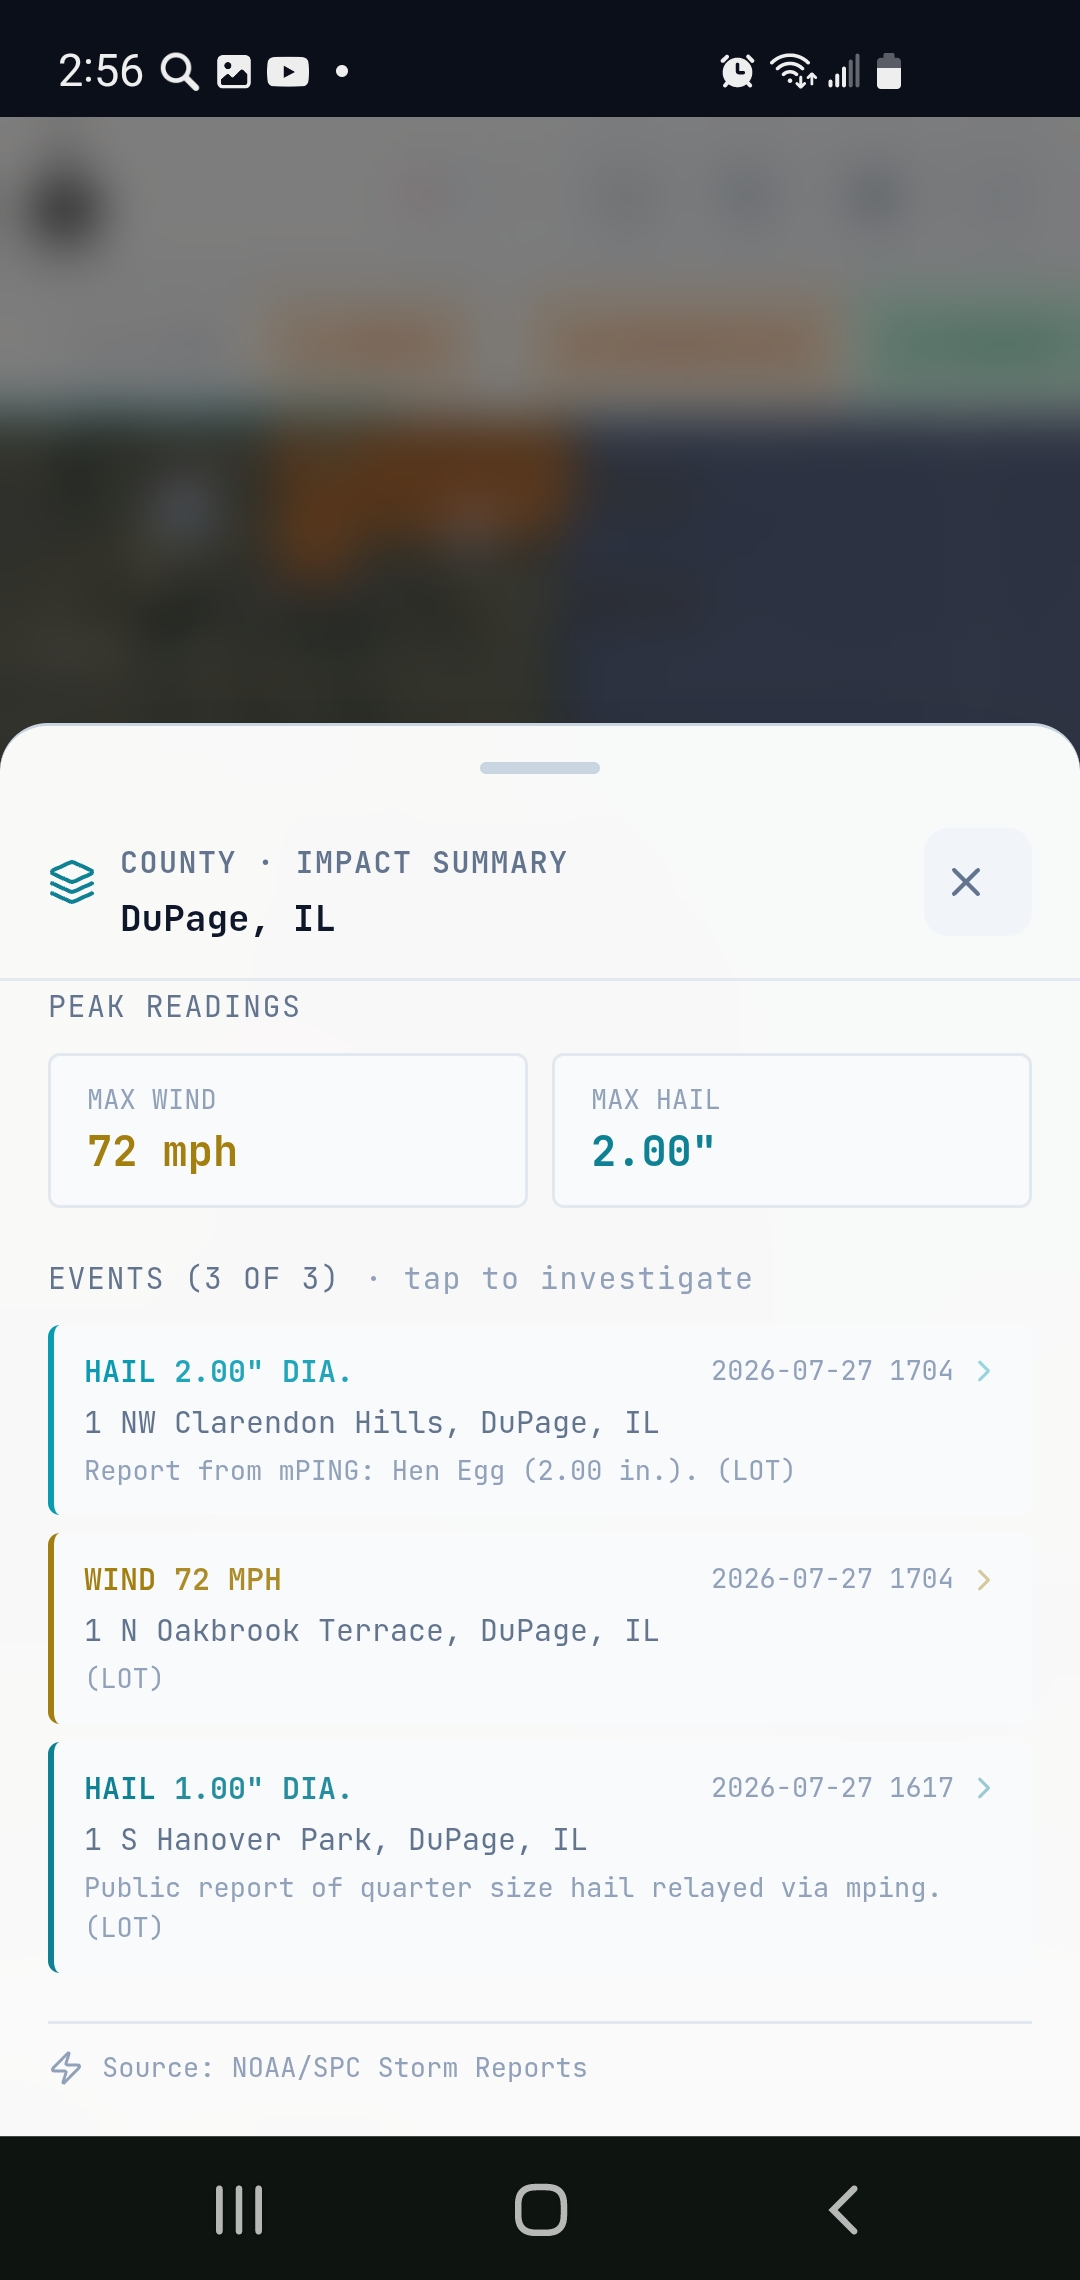
Zooming into the northern Illinois epicenter at 2:56 PM, the DuPage County Impact Summary panel showed the following confirmed reports, all logged within hours of the storm's passage:
| Event | Size / Speed | Location | Time (UTC) |
|---|---|---|---|
| Hail | 2.00" diameter | 1 NW Clarendon Hills | 2026-07-27 17:04 |
| Wind | 72 mph | 1 N Oakbrook Terrace | 2026-07-27 17:04 |
| Hail | 1.00" diameter | 1 S Hanover Park | 2026-07-27 16:17 |
The Individual Event Record: EXTREME Severity
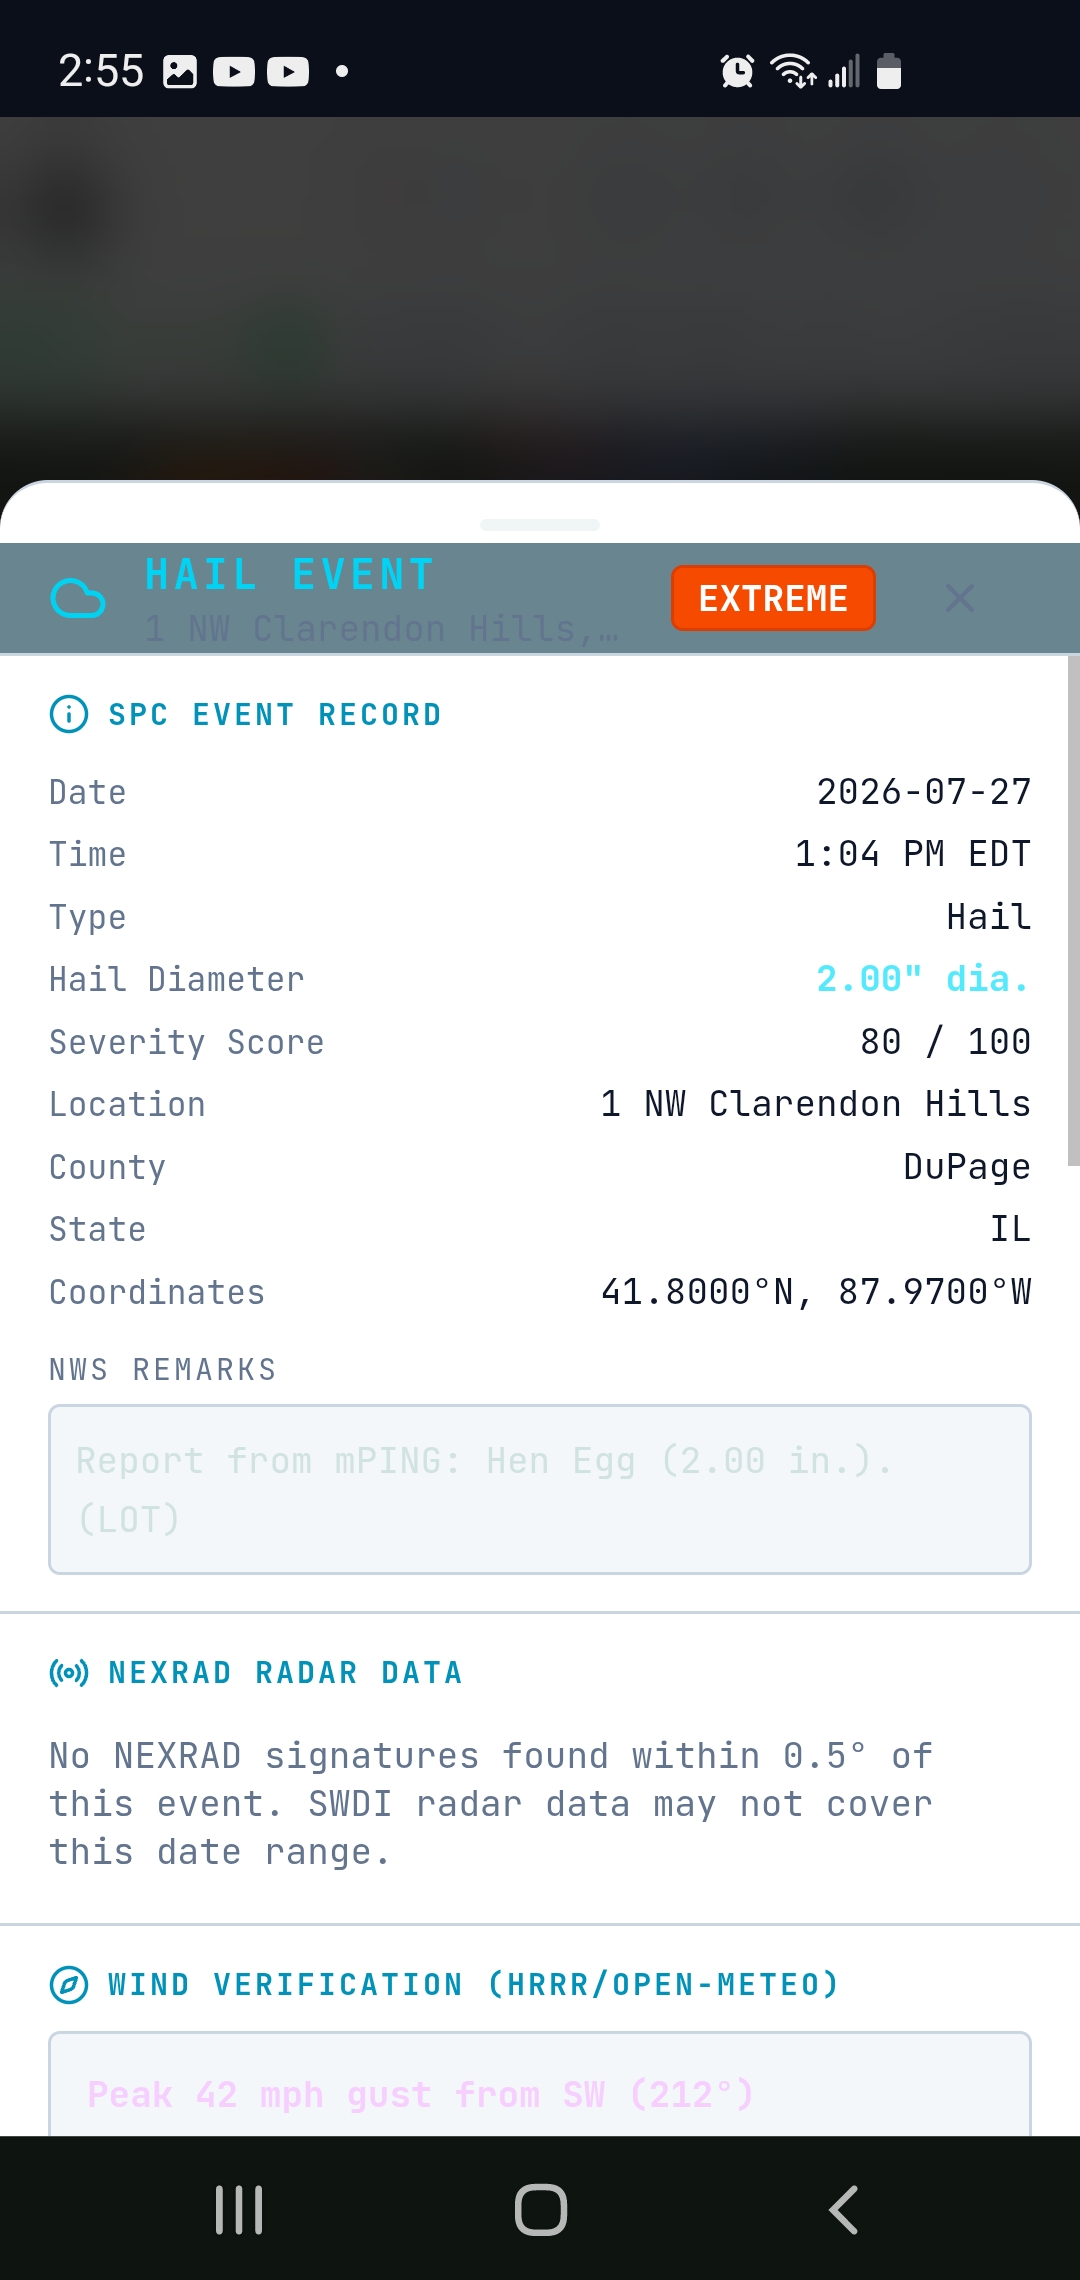
Tapping the 2.00" Clarendon Hills marker opened the full SPC Event Record. The platform rated this event EXTREME with a severity score of 80 out of 100. The record included:
- Date/Time: July 27, 2026 at 1:04 PM EDT
- Hail Diameter: 2.00 inches (Hen Egg)
- Severity Score: 80 / 100
- Location: 1 NW Clarendon Hills, DuPage County, IL
- Coordinates: 41.8000°N, 87.9700°W
- NWS Remarks: "Report from mPING: Hen Egg (2.00 in.). (LOT)"
- Wind Verification (HRRR/Open-Meteo): Peak 42 mph gust from SW (212°)
Why Population Context Matters for Field Teams
DuPage County is one of the most densely populated counties in Illinois — Naperville, Wheaton, Downers Grove, Oakbrook Terrace. A 2.00" hail event causes significant roof damage to asphalt shingles, gutters, skylights, and HVAC equipment. A 72 mph wind gust compounds that substantially.
Here is what the timeline looked like today:
- 16:17 UTC (11:17 AM CDT) — First hail report logged in Hanover Park (1.00")
- 17:04 UTC (12:04 PM CDT) — Peak hail (2.00") and peak wind (72 mph) logged simultaneously
- 2:53 PM CDT — THOR showing live radar, outbreak polygon, and hail markers on the map
- 2:56 PM CDT — Full DuPage County Impact Summary available with all three events listed
That is a window of roughly two hours between the first confirmed hail report and a complete, mapped county-level impact summary while the storm was still active. Once the event is mapped, Market Priority can rank the current reports by households, residential density, population, or a combined residential score. That gives a field team a clearer way to compare affected markets before deciding where closer inspection and follow-up make sense.
Try It Live
THOR Storm Mapper is available at www.thorstormmap.com. The next time a storm system moves through your market, open the map before it arrives. By the time the last cell clears, you'll already know exactly where to go.
Data sources: NOAA/SPC Storm Reports, mPING (NWS Crowdsourced Precipitation Network), HRRR/Open-Meteo wind model, NEXRAD composite radar. All screenshots captured live on July 27, 2026 between 2:53–2:56 PM CDT during an active severe weather event.