
Navigation
THOR Storm Mapper

THOR Storm Mapper

NOAA/SPC SEVERE WEATHER INTELLIGENCE

Hail Maps forRoofing and Exterior Contractors, Public Adjusters, and Property Professionals.

Find new storm-driven work, document fresh hail, prioritize the right neighborhoods with storm and population data, and reconnect with past customers after the next storm.

THOR Storm Mapper turns NOAA severe-weather history into practical intelligence for roofing contractors, public adjusters, and homeowners.

  • Research past storm activity — search reported hail, tornadoes, wind events, tracks, and outbreaks by date and location.
  • Understand the full storm picture — compare reported events with NEXRAD Hail Signatures, MRMS Hail Swaths, and Timeline radar replay.
  • Work the map faster with AI Mode — ask in plain language to search places, adjust layers and filters, or get workflow help by text or optional microphone.
  • Identify the best storm-affected streets — canvass the right neighborhoods, prioritize outreach, and turn MRMS hail swaths directly into canvassing territories for your team.
  • Prioritize opportunities with Market Priority — compare affected areas by Census households, housing density, and population.
  • Create documentation for the conversation — generate property and storm reports with location-specific weather context.
  • Monitor customers and prospects for new storm hits — save lead or property addresses, set your storm criteria, and get notified when qualifying hail, wind, or tornado activity occurs nearby.

Affordable nationwide hail maps for roofing contractors

One $34 monthly plan covers all 50 states. Start with a 14-day free trial, no credit card and no per-state fee.

Business Team plan for roofing offices: add as many active team members as you need for $15/month each. Team seats stay monthly even if the business owner chooses an annual base subscription.

No credit card required — 14-day free trial
Playing

Live Storm Tracking

Field workflow

Canvass the storm. Work every lead.

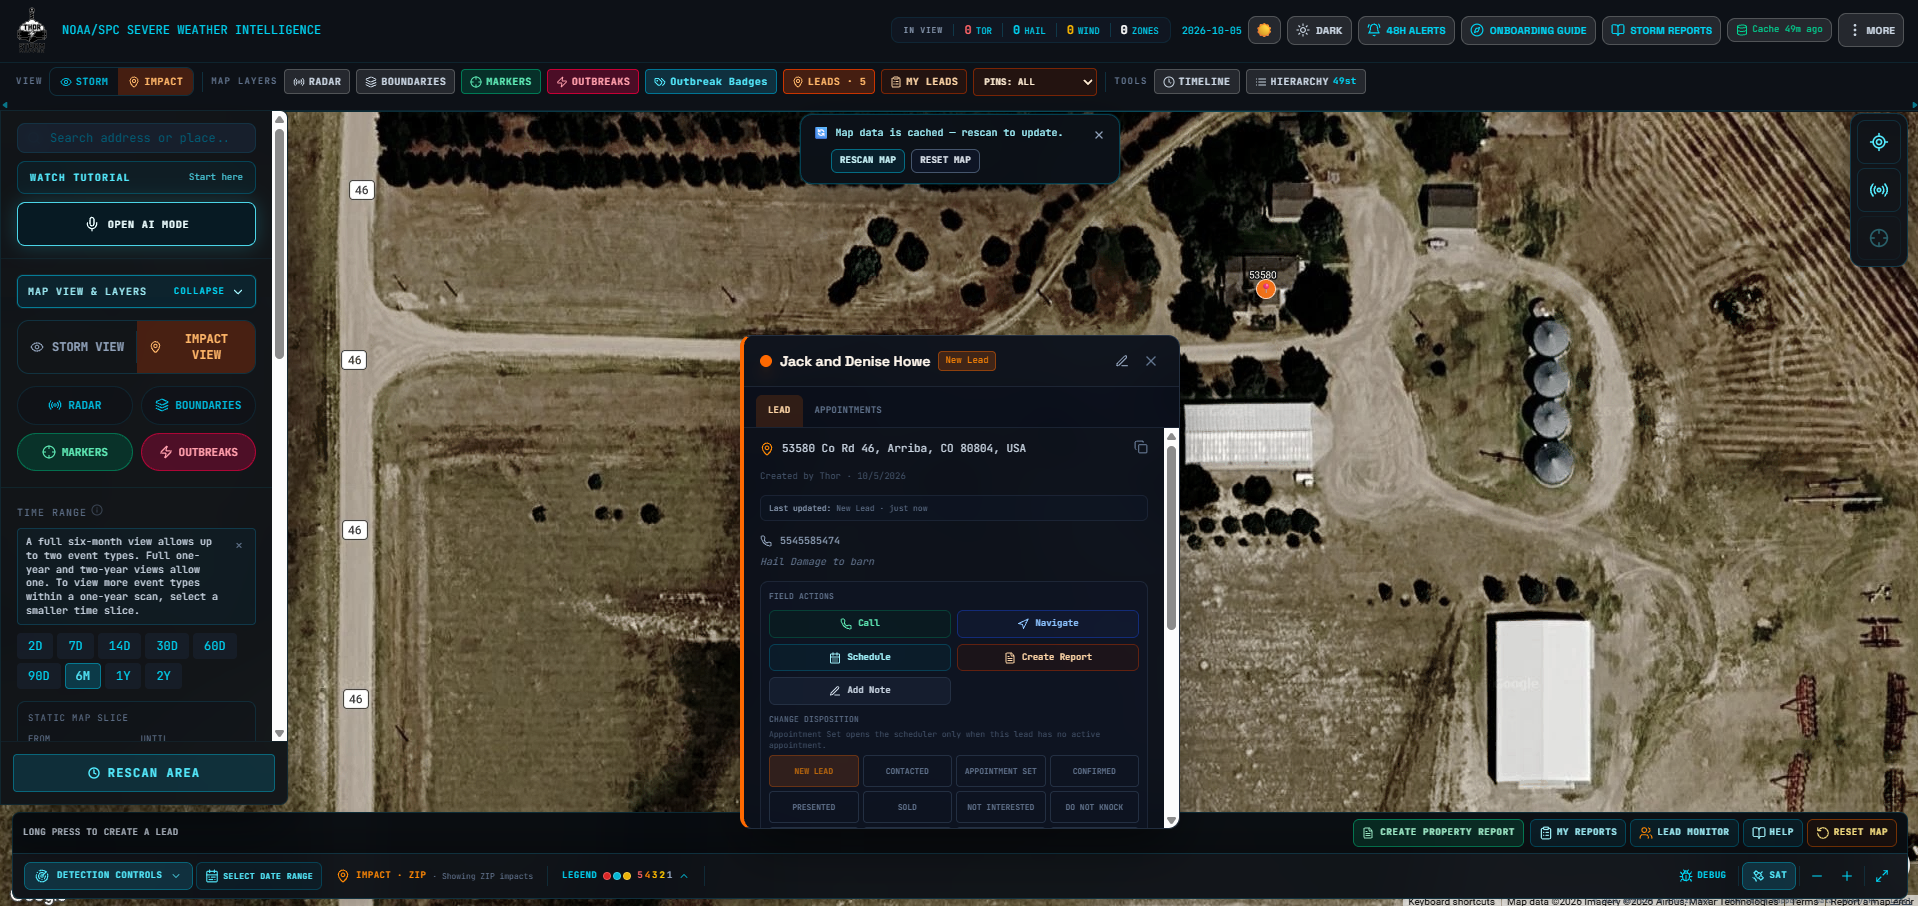
Move from the impact map or an MRMS Hail Territory to a real next step: open the lead, call or navigate, set an appointment, create the report, and keep the storm evidence with the work. Field GPS and Report Here keep the workflow close to the property.
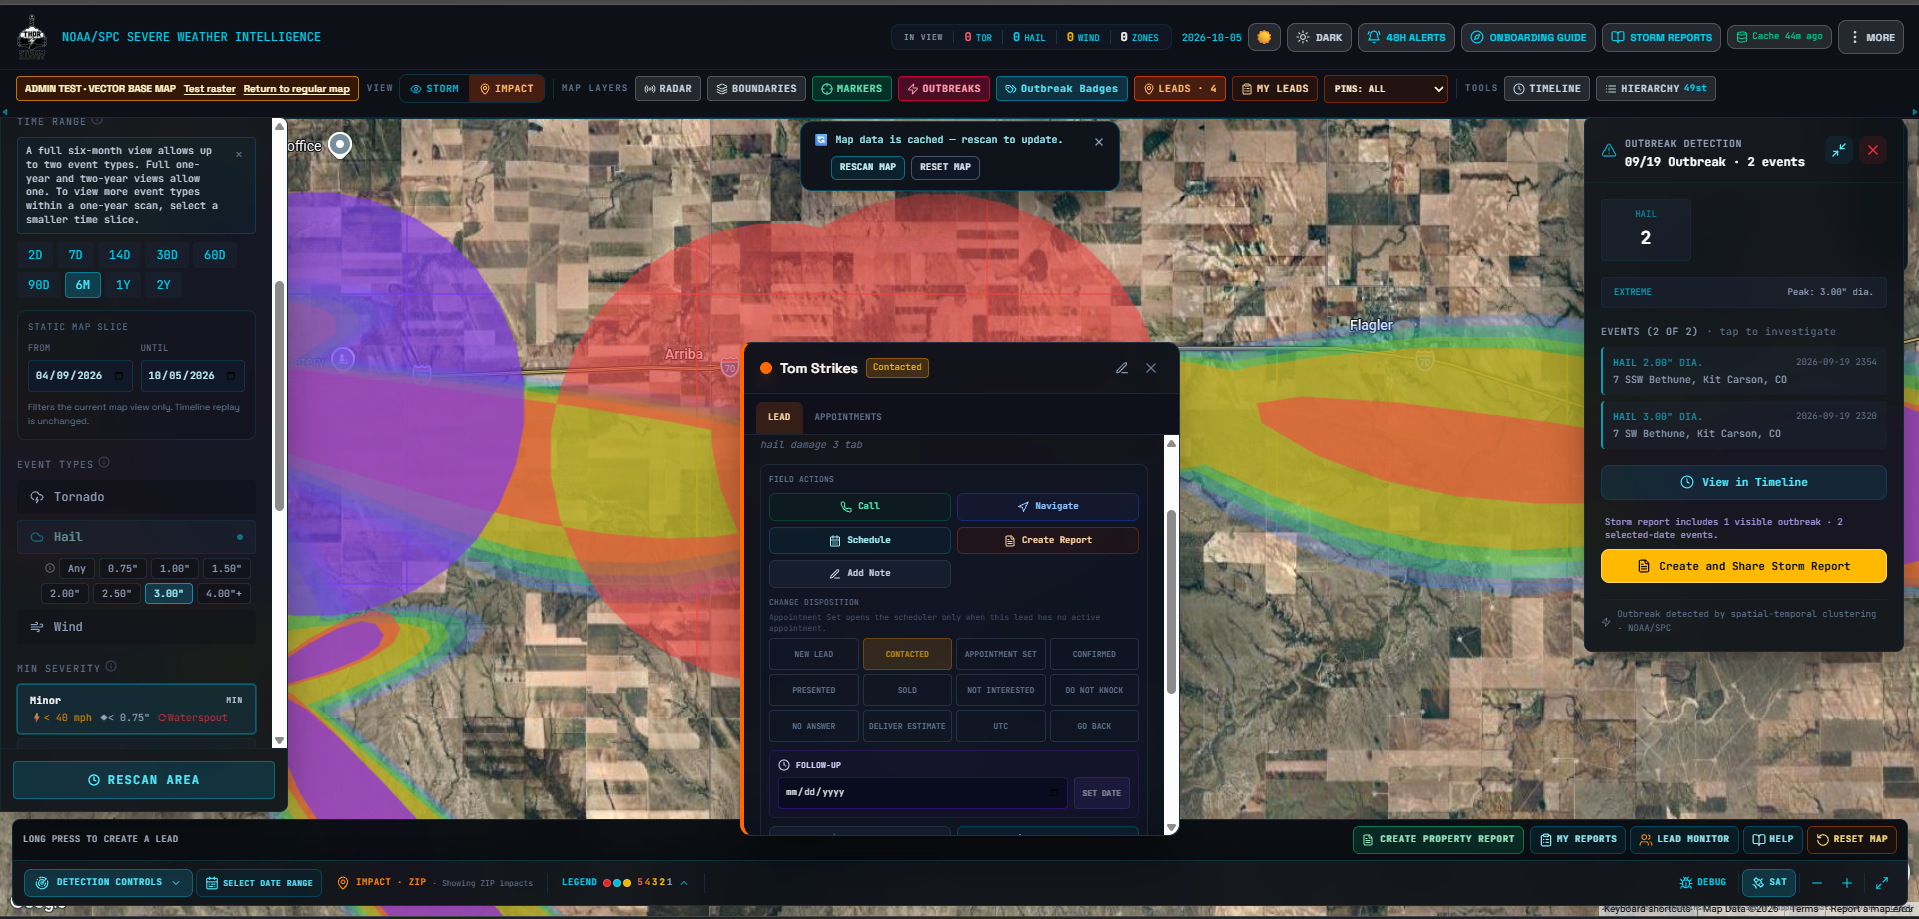
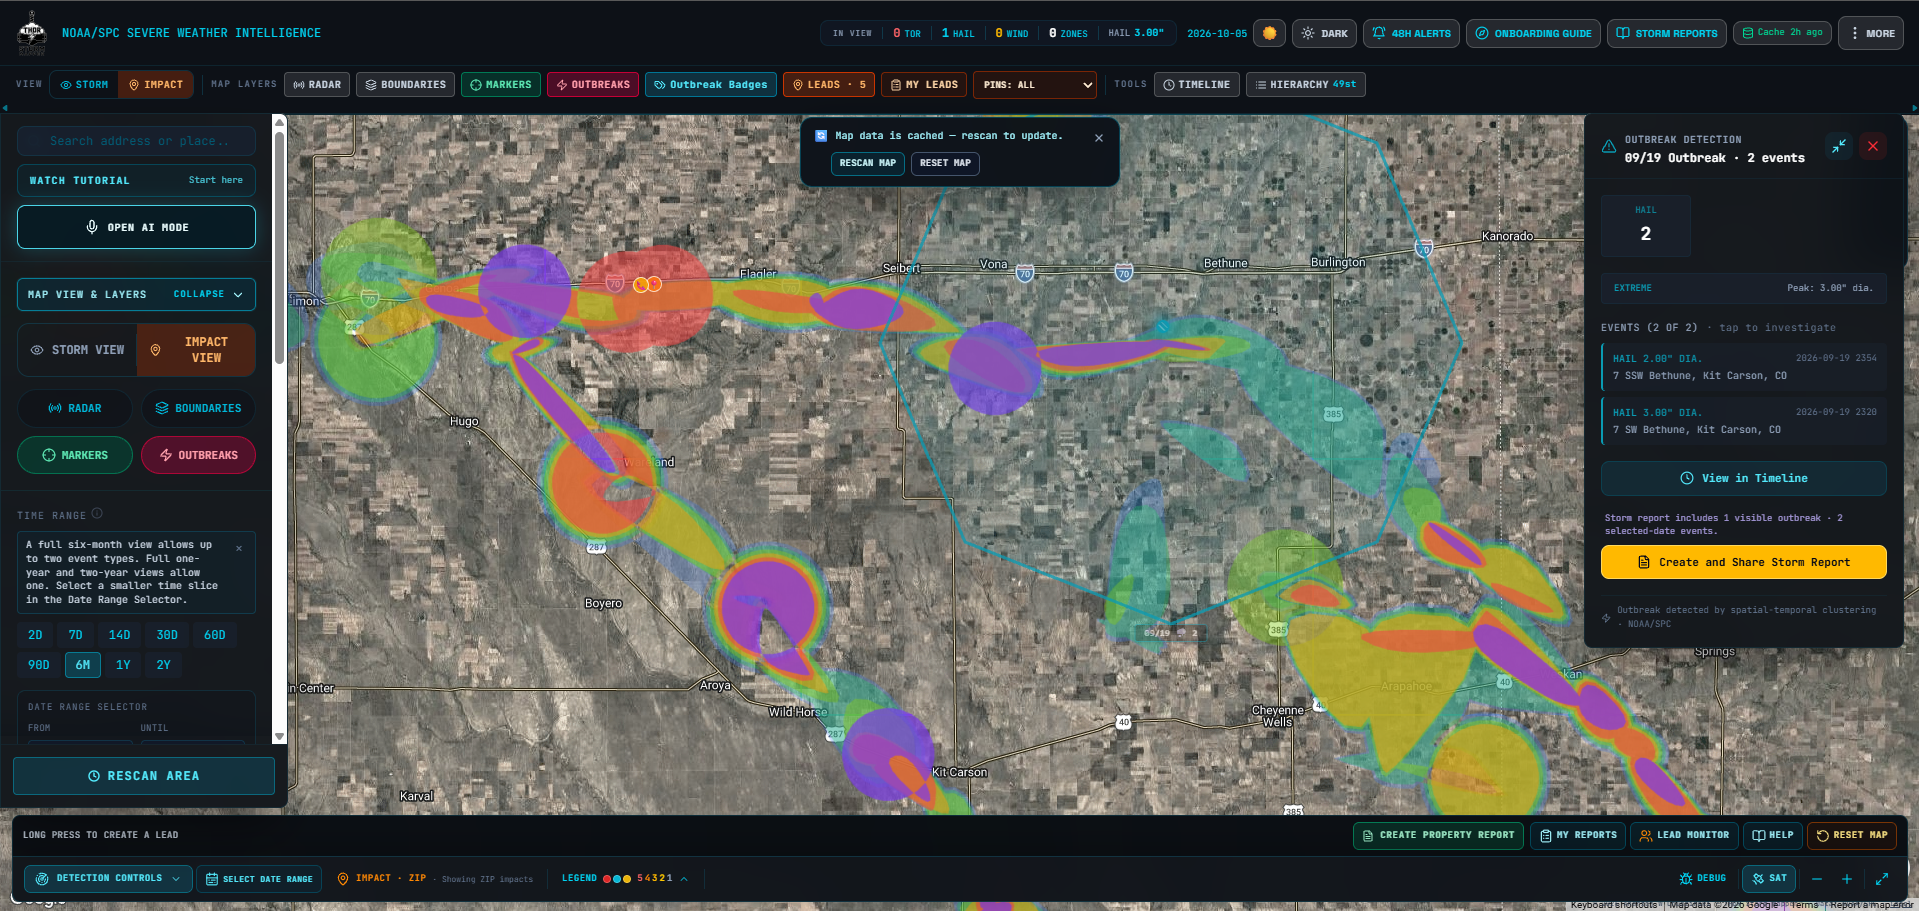
THOR Impact View with hail swaths, an outbreak detail panel, and a lead card open with field actions and dispositions
Storm context to field action

Open the storm. Work the lead.

See the impact area, investigate the outbreak, then call, navigate, schedule, create a report, or update the disposition from the same map.

Create map leads, import your list, or share and assign MRMS territories

Call, navigate, schedule, and update dispositions from the lead card

Keep visit history, notes, appointments, and dated follow-up tied to the property

Bulk-scan geocoded leads against available two-year storm history

Paid accounts can bulk-scan every geocoded lead against THOR's available two-year storm history, flag past qualifying storm hits, and focus reinspection on customers who deserve another look.
Business memory

Your storm evidence, saved

Property Storm History Reports and Outbreak Storm Reports stay in My Reports after they are created. Your reports are saved to your account, ready to reopen, download, or share when a homeowner, adjuster, or crew needs the record later. Compare NEXRAD and MRMS hail layers in storm and event reports, export both with separate legends, and select historical hail events to update available property-report imagery.

See the report library

Event confidence

Multiple sources. A clearer event picture.

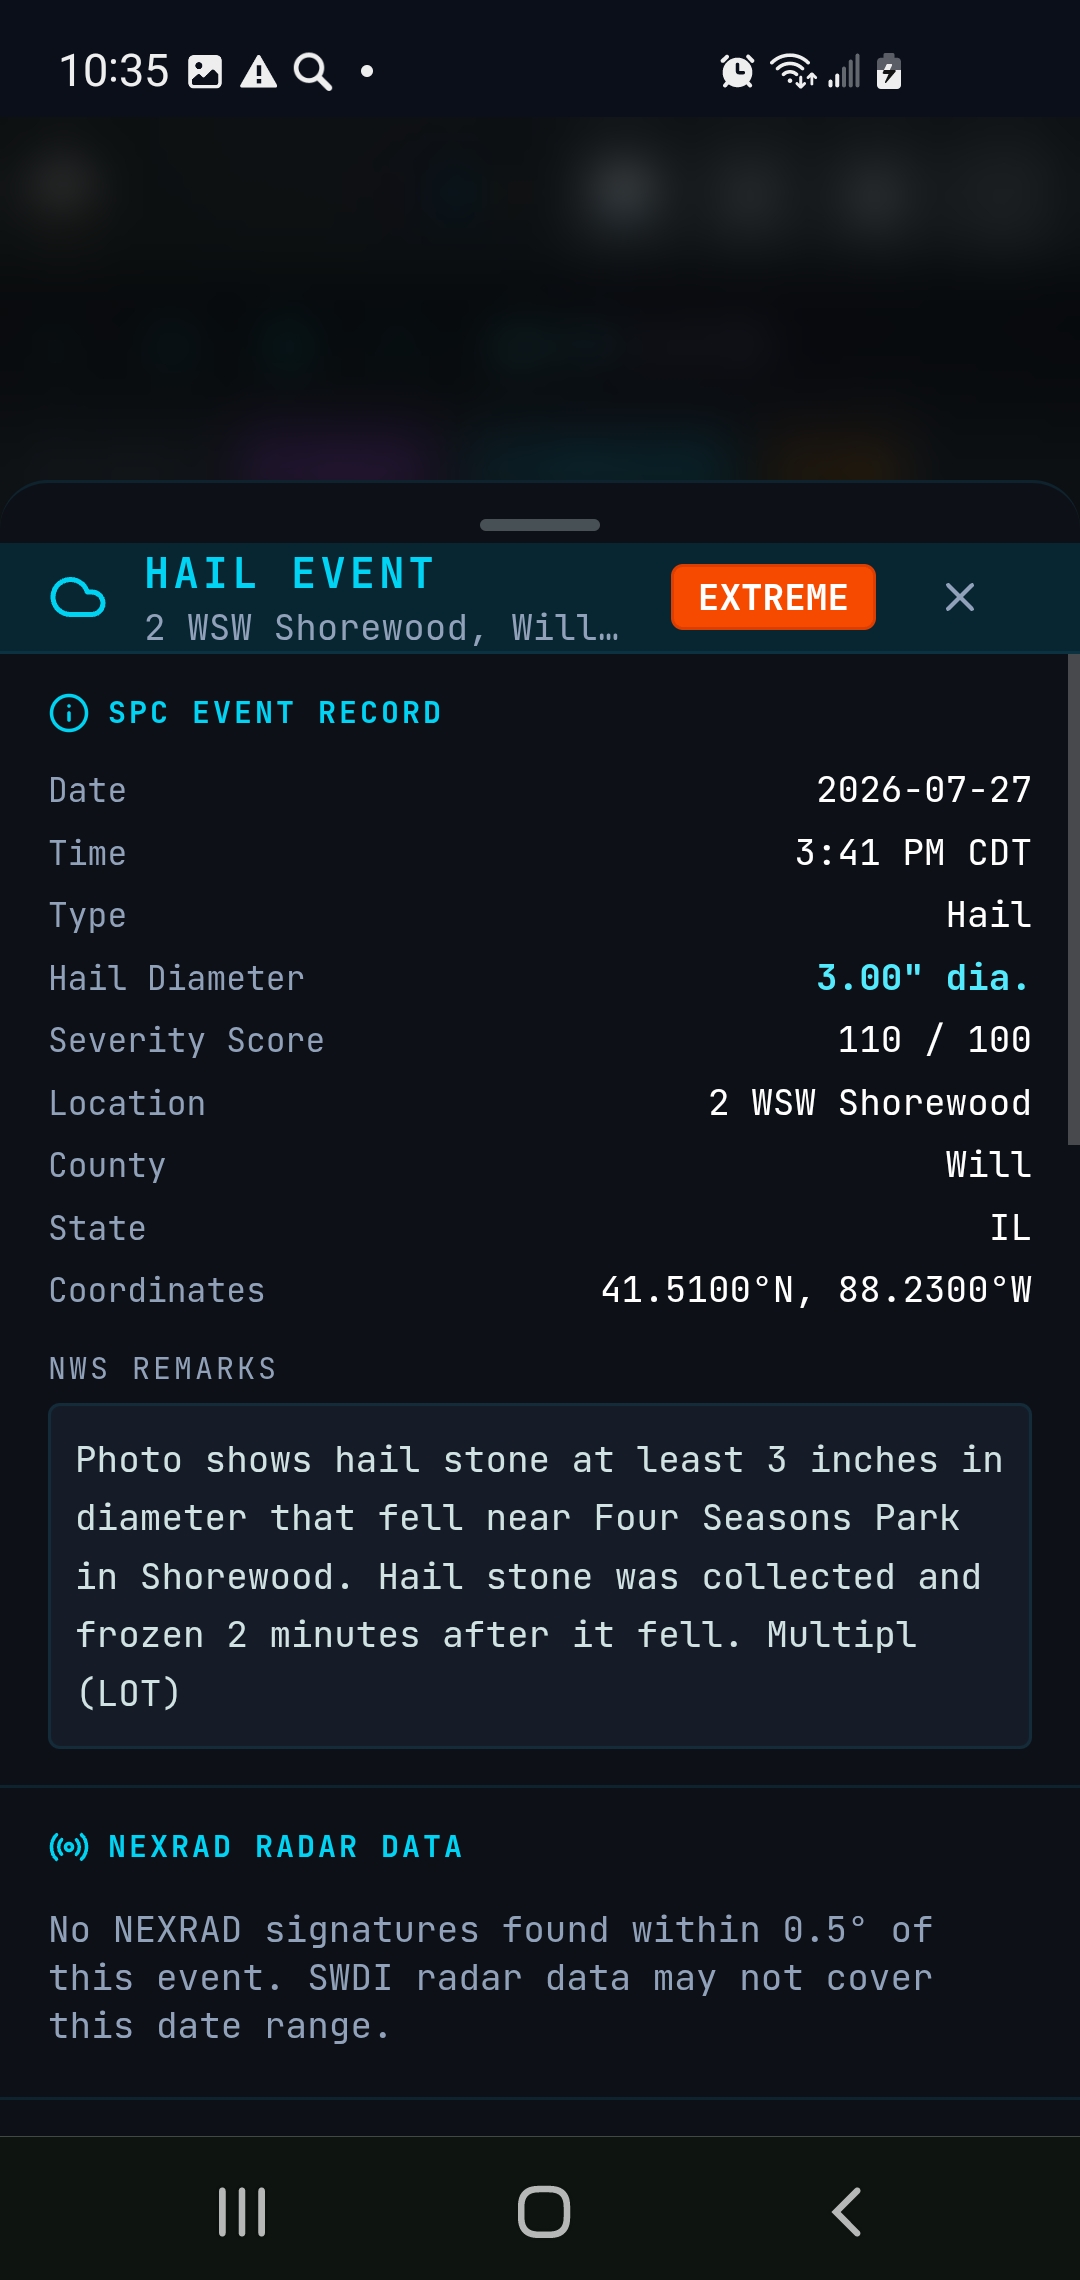
THOR puts NOAA/SPC event reports, NWS spotter remarks, NEXRAD Hail Signatures, MRMS Hail Swaths, and NEXRAD replay into the same storm context. Compare the evidence before choosing where to work and what to document.

NOAA/SPC reportsNWS spotter remarksNEXRAD Hail SignaturesMRMS Hail SwathsNEXRAD replay
Hail Impact Zone Maps

Pinpoint every hail event by state, county, and ZIP. Know exactly which neighborhoods took a hit before you make a single call.

THOR Hail Impact Zone Map showing color-coded hail impact areas, outbreak detail, and the field map controls
Hail Impact Zones · outbreak evidence on the map
Market Priority with Census Context — Roofripe

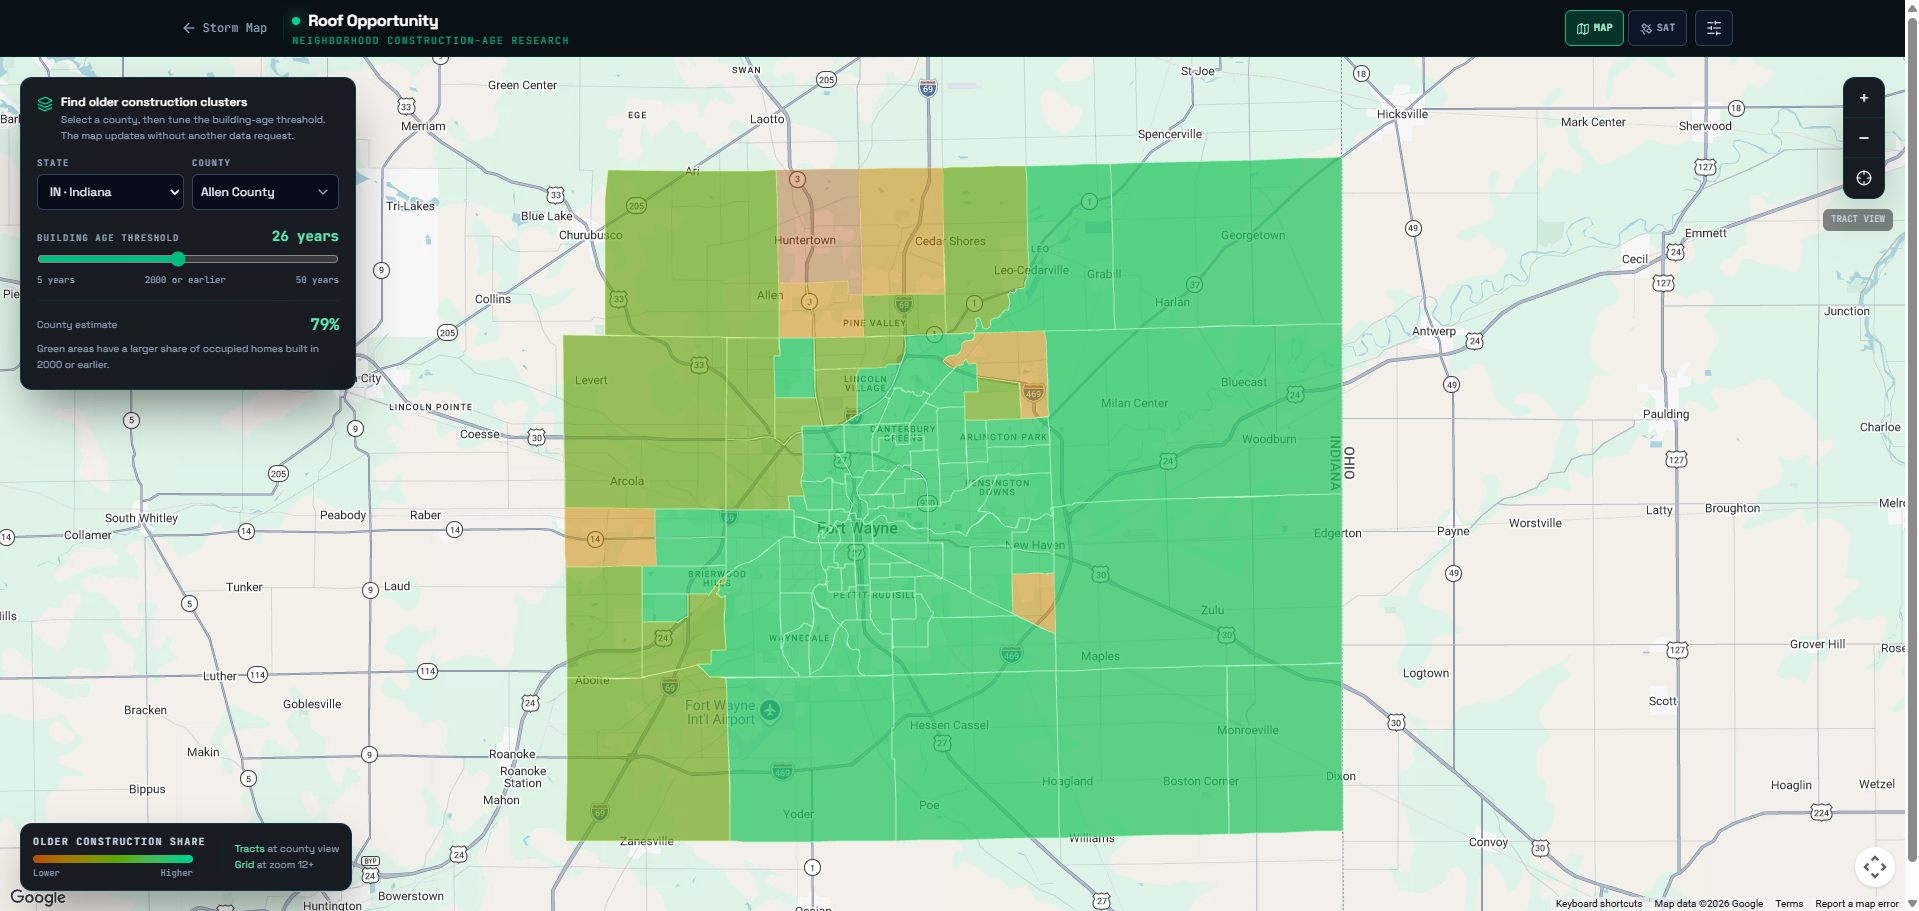
Rank storm-affected areas by households, residential density, population, or a combined residential score. Roofripe is THOR’s separate construction-age research map for identifying neighborhoods with a higher share of older occupied homes before you build your canvassing route.

Roofripe construction-age research map showing neighborhood areas by share of older occupied homes
Roofripe · neighborhood construction-age research
Multi-Source Storm Evidence

Compare NOAA/SPC event reports, NWS spotter remarks, NEXRAD Hail Signatures, NOAA MRMS Hail Swaths, and NEXRAD replay for a clearer event picture before you act.

MRMS Hail Territories

Turn the MRMS evidence loaded with an outbreak or hail event into a saved field territory. Reopen it later, then share and assign it to the teammates who need it.

Storm Tracks & Outbreaks

Visualize tornado paths, wind storm corridors, Heat Grid, and multi-event outbreak clusters so you can target the highest-density damage areas.

Storm Alerts & Email Notifications

Get push notifications and email alerts the moment severe weather hits your target area — even when the app is closed. Be the first crew on the street, not the fifth.

Radar Overlays

Overlay active radar on the impact map to see storms as they move. Predict where damage is happening right now.

Historical Storm Data

Query up to 2 years of storm history. Find markets that were hit repeatedly, build a canvassing strategy around real data, and pull NOAA-verified records to document storm activity long after the storm has passed.

CSV & KML Export

Download storm data as CSV for CoreLogic, SalesRabbit, and any CRM — or as KML for Near Map and Google Earth aerial overlays. Your THOR data, in your workflow, instantly.

Property Storm History Reports

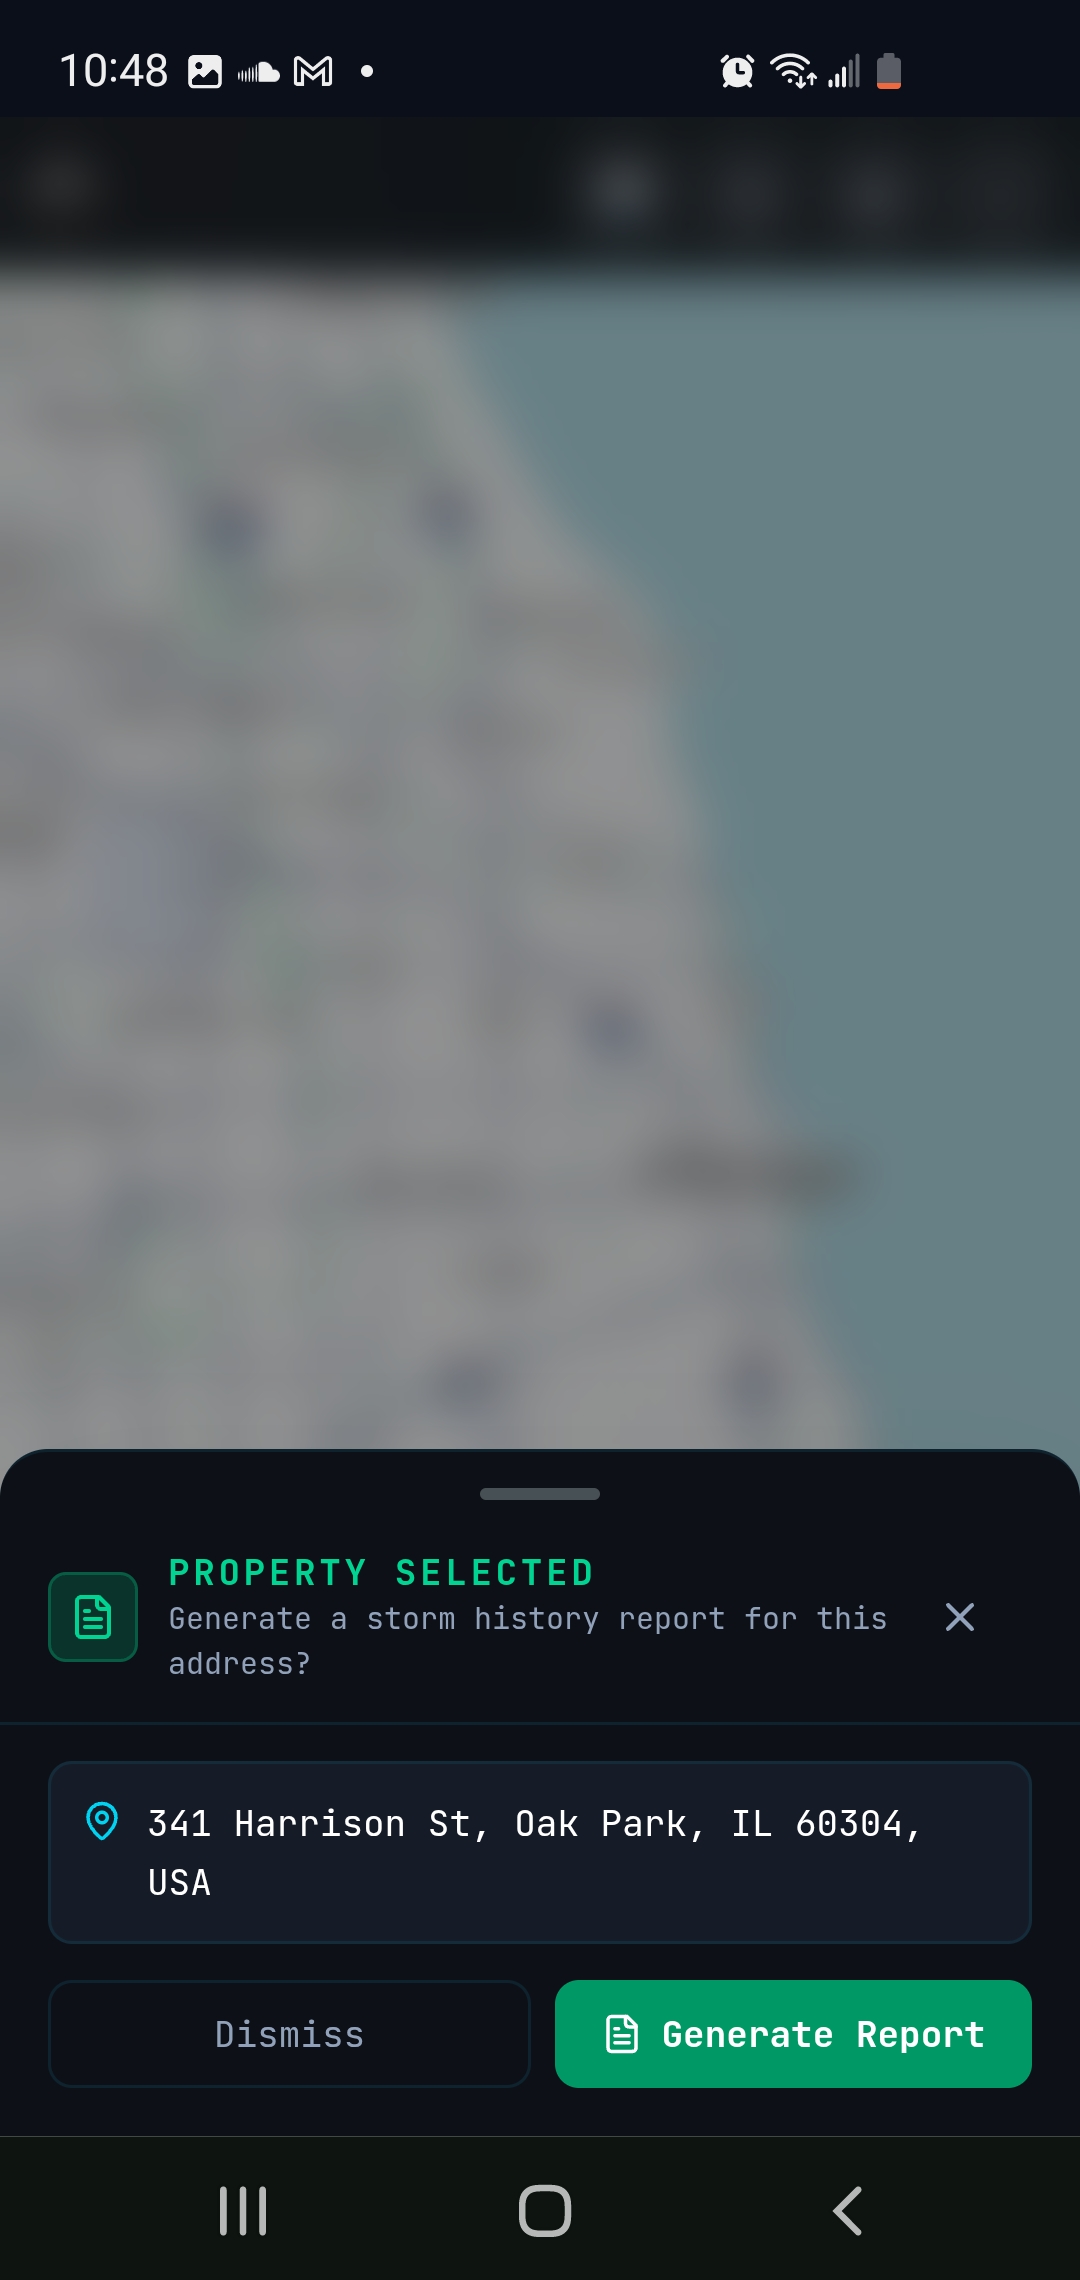
Generate a one-click PDF storm history for any address — every hail event, tornado, and wind record within 1 mile, going back to 2014. Select a historical hail event to update available hail imagery, then save, re-download, or share the report anytime.

Storm-Triggered Lead Intelligence Alerts

Upload your entire lead base from Spotio, Salesforce, JobNimbus, or any CSV. THOR watches every address around the clock — the moment a qualifying storm hits within your set radius, you get a push notification and email so you're first to the door. Drop lead pins directly on the map, track dispositions, and export storm-hit leads straight to your CRM. Turn a weather event into a closed job.

Built-In Canvassing Workflow

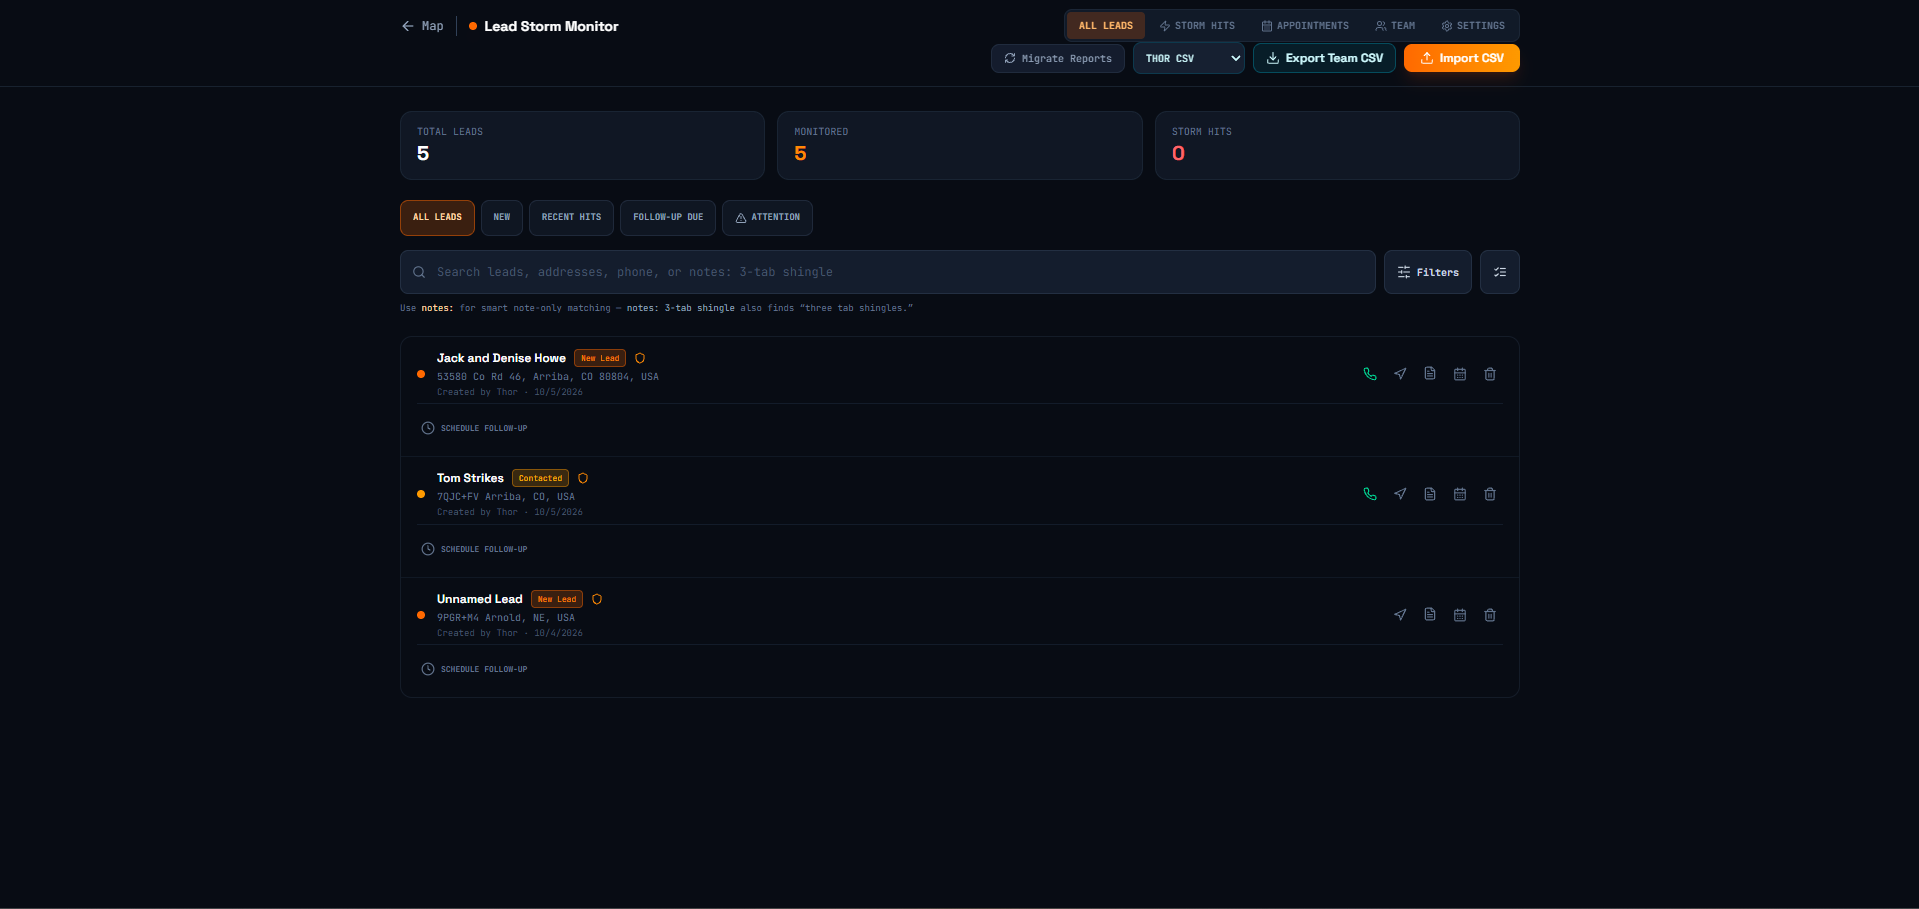
Import leads from CSV or long-press the map to add a pin. Track dispositions, log visit notes with history, set follow-up dates, call or drive from each lead card, open property reports, review Storm Hits, and monitor each lead locally or with the 25-mile Area Monitor.

Timeline Playback & Radar Replay

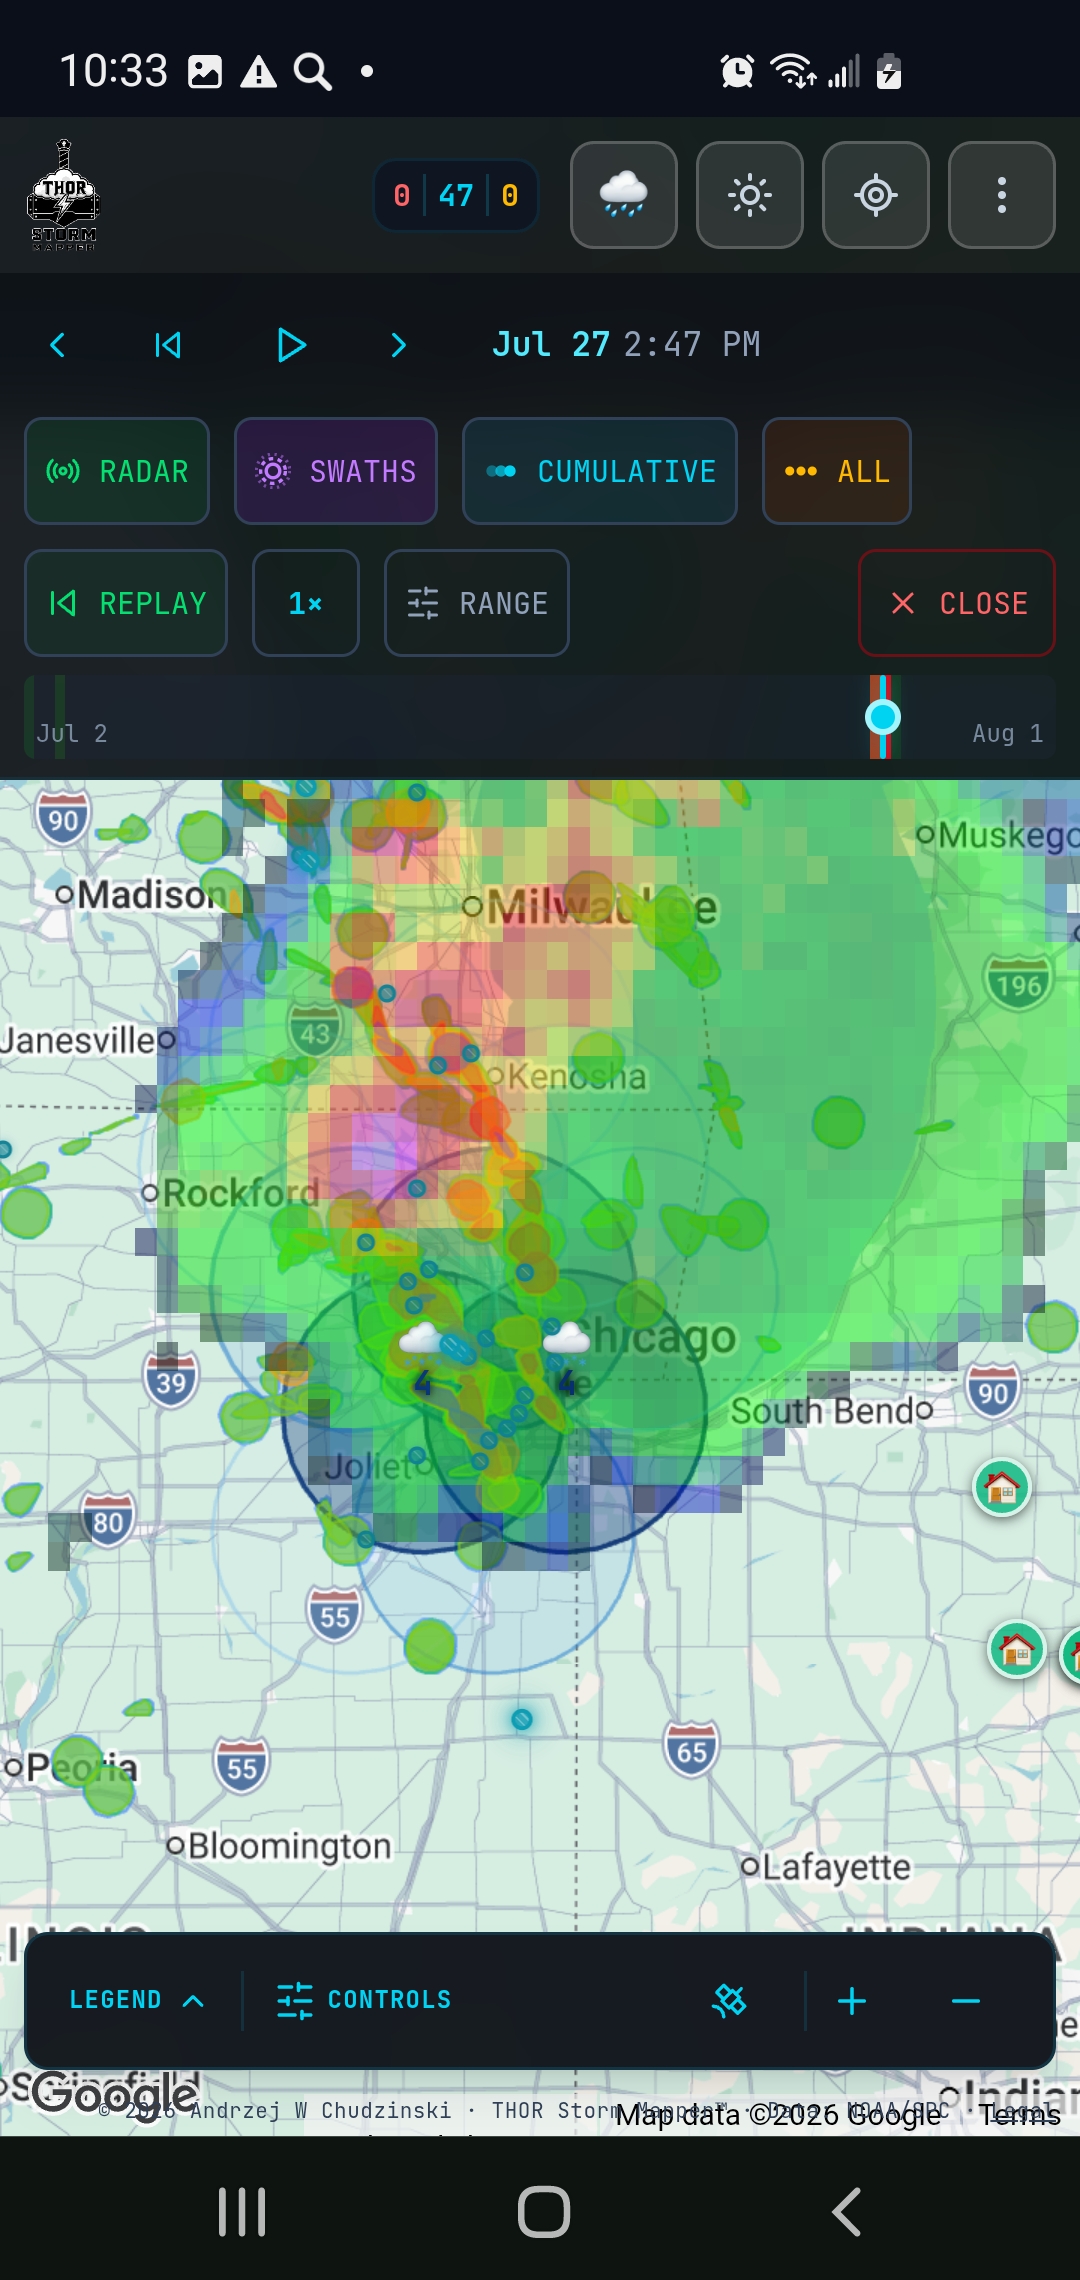
Scrub through any storm event frame by frame — watch hail swaths build in real time, replay NEXRAD radar from the moment the storm hit, and sync outbreak markers to the exact minute. Present the full storm sequence to a homeowner or adjuster and let the data do the selling.

Text-First AI Mode

Ask in plain language to search a place, adjust map layers and filters, or get workflow help. Type requests or use the optional microphone while you work.

Who THOR helps

Storm intelligence shaped around your next move.

Explore a practical THOR workflow for the work you do—from finding the next roof market to researching an address, organizing field follow-up, or studying how a storm unfolded.

Roofing contractors

Find the storm markets worth working next.

See NOAA/SPC hail, wind, and tornado reports across all 50 states on one browser-based map.

Explore this workflow
Roofing sales teams

Keep storm-driven follow-up on the map.

Watch monitored, geocoded addresses for qualifying hail, wind, and tornado events.

Explore this workflow
Exterior restoration

Read the storm corridor before you dispatch a team.

Put hail, wind, tornado, radar, tracks, and outbreaks together instead of relying on one point layer.

Explore this workflow
Public adjusters

Put the storm story in one place before inspection.

Build a Property Storm History around nearby weather records and keep it in My Reports.

Explore this workflow
Real-estate professionals

Give every address a storm history worth having.

See nearby hail, wind, and tornado records around a property instead of relying on regional headlines.

Explore this workflow
Homeowners

Know the storm history around your home.

Start with a state or city page to see recent storm activity near where you live.

Explore this workflow
Storm chasers

Read the storm story on one field-ready map.

See NOAA/SPC hail, wind, and tornado events beside NEXRAD radar overlay and replay.

Explore this workflow
Weather researchers

Explore how a storm unfolded, from report to replay.

Scan up to two years of reported storm activity and use Timeline to inspect the event sequence.

Explore this workflow

Full app walkthrough

Want the full tour?

This walkthrough covers the rest of THOR—from the map and reports to alerts, lead tools, and settings.

Why THOR Wins You More Jobs

  • Know the storm before you drive. NEXRAD and MRMS hail swaths, reports, radar replay, and Timeline show what hit, where it hit, and when.
  • Choose streets worth working. Impact maps and Market Priority combine storm history with household and residential context so canvassing starts in better territory.
  • Canvass directly inside an MRMS hail swath. Save it as an MRMS Hail Territory, then drop lead pins, call, navigate, update dispositions, schedule appointments, and log visits and follow-up.
  • Keep the team moving from one map. Reps work their own leads while owners see the shared pool, storm hits, appointments, and results.
  • Put evidence in the customer’s hands. Create property, storm, and individual-event reports for homeowners, adjusters, and office follow-up.

What to compare before choosing a hail map

Price
✓$34/month after the 14-day free trial
Team seats
✓Business owners can add unlimited active team members for $15/month each; team seats stay monthly even with an annual base plan
Coverage
✓All 50 states in the same subscription
Weather
✓NOAA/SPC hail, tornado, and wind reports with radar-derived hail swaths
Workflow
✓Timeline replay, property reports, exports, and built-in canvassing with lead pins, dispositions, call/drive actions, Storm Hits, and monitoring
Commitment
✓Month to month, with no annual contract or per-state add-on
Compare current hail-map options and published pricing

Built for growing roofing offices

Put your whole team on the same storm picture.

Give every rep their own THOR login and full map access. Your business owner keeps one shared lead pool, sees storm hits across the team, manages seats, and can import or export team lead data. Reps can create and manage their own leads, while the business owner maintains control of the full team lead pool.

$15/month per active member

Monthly team seats, including for annual base subscribers.

See how Business Teams work
Live Product Screenshots

Built for the Field. Designed to Win Jobs.

THOR is a universal web app that works on Android, iOS, and PC, built for roofing contractors and storm chasers. Here's what you'll see the moment you log in.

Timeline Playback + Hail Swaths

Replay Any Storm. Watch the Hail Swaths Lay Down in Real Time.

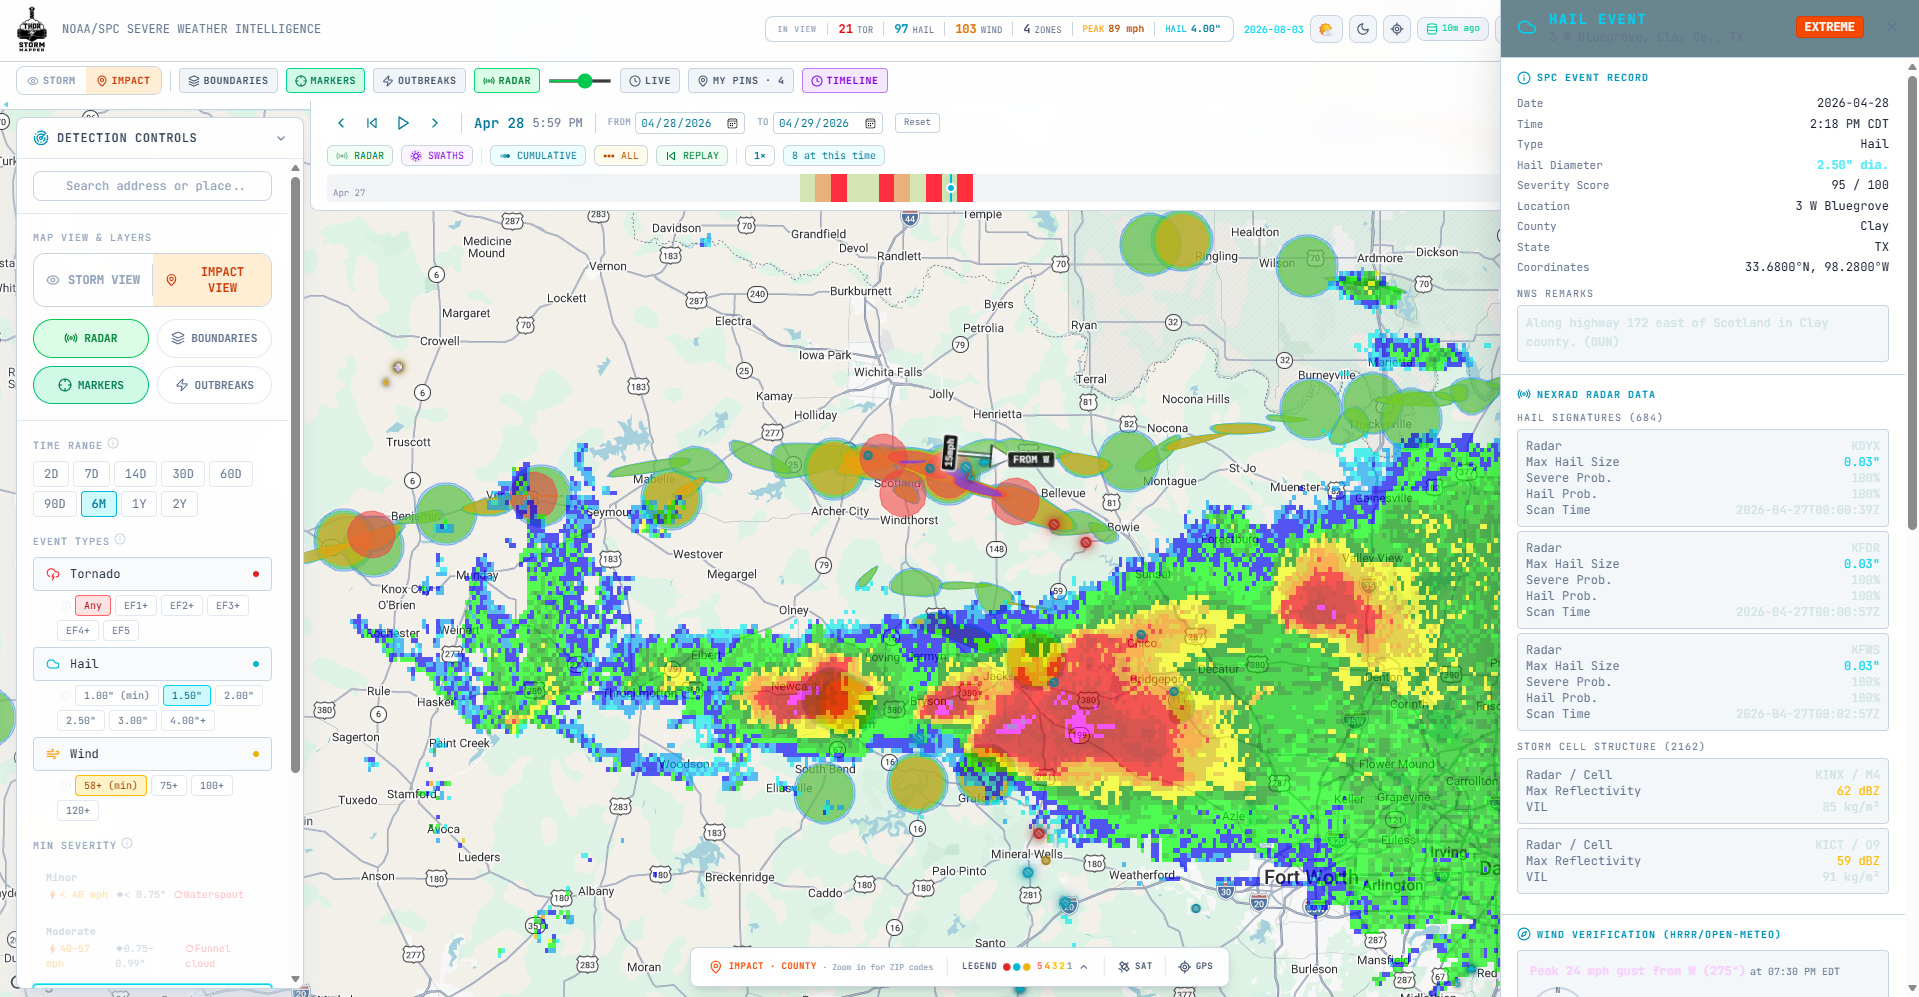
Hit Timeline and scrub back to any storm event. THOR overlays NEXRAD radar and MRMS-derived hail swaths simultaneously — the colored corridors show exactly where hail fell, how wide the swath was, and how severe it was at each point. This screenshot captures the April 28, 2026 North Texas outbreak: 8 events active at this timestamp, cumulative hail swaths painted across Clay, Archer, and Wichita counties, with a 2.50" EXTREME event at 3 W Bluegrove open in the detail panel. 684 NEXRAD hail signatures. 62 dBZ max reflectivity. This is how you find the damage corridor before you drive it.

THOR Storm Mapper timeline playback with NEXRAD radar and hail swath corridors over North Texas April 28 2026
Timeline Replay in Action

Watch the Storm Build Before You Drive There.

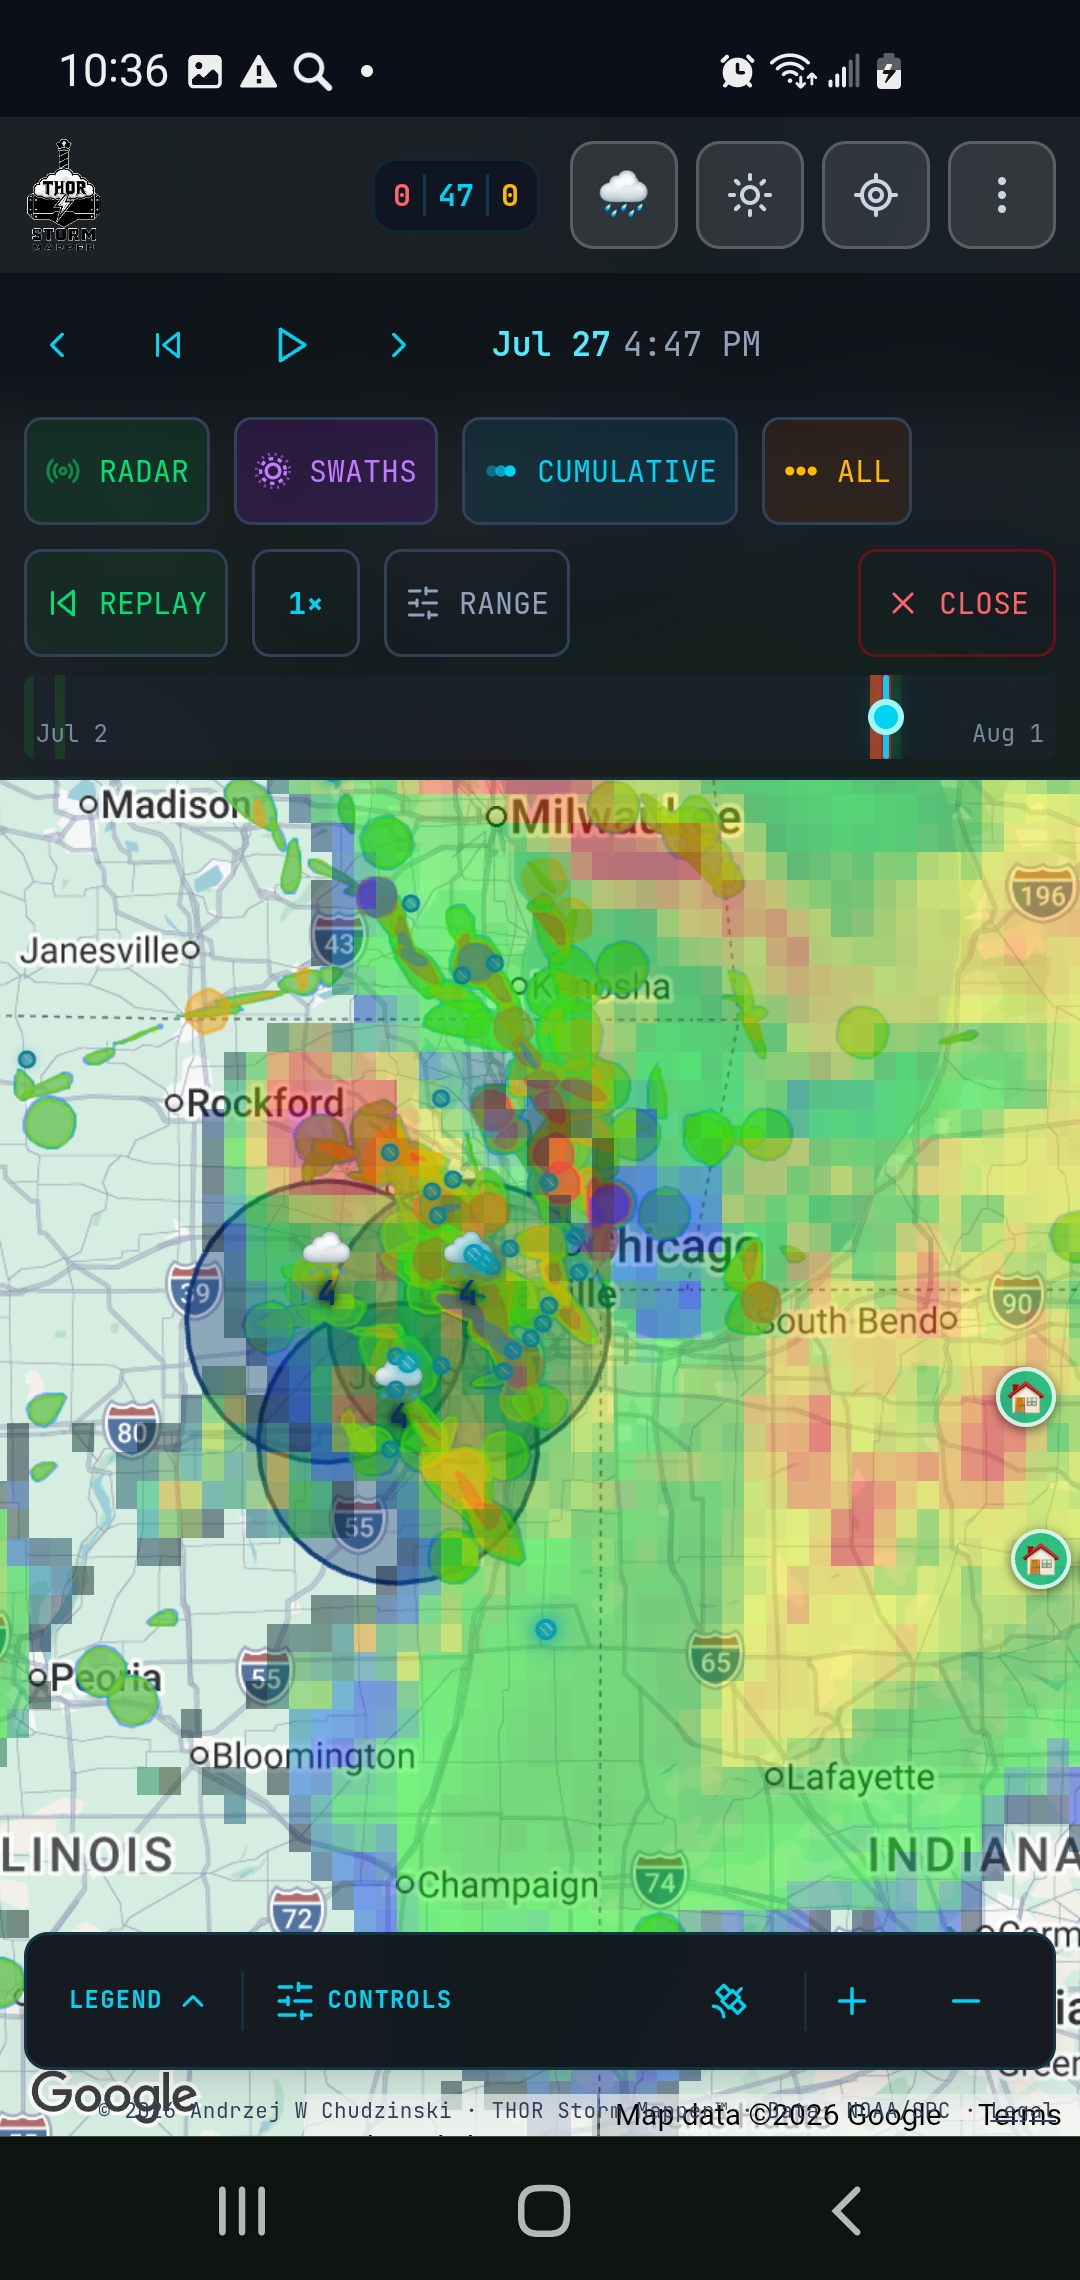
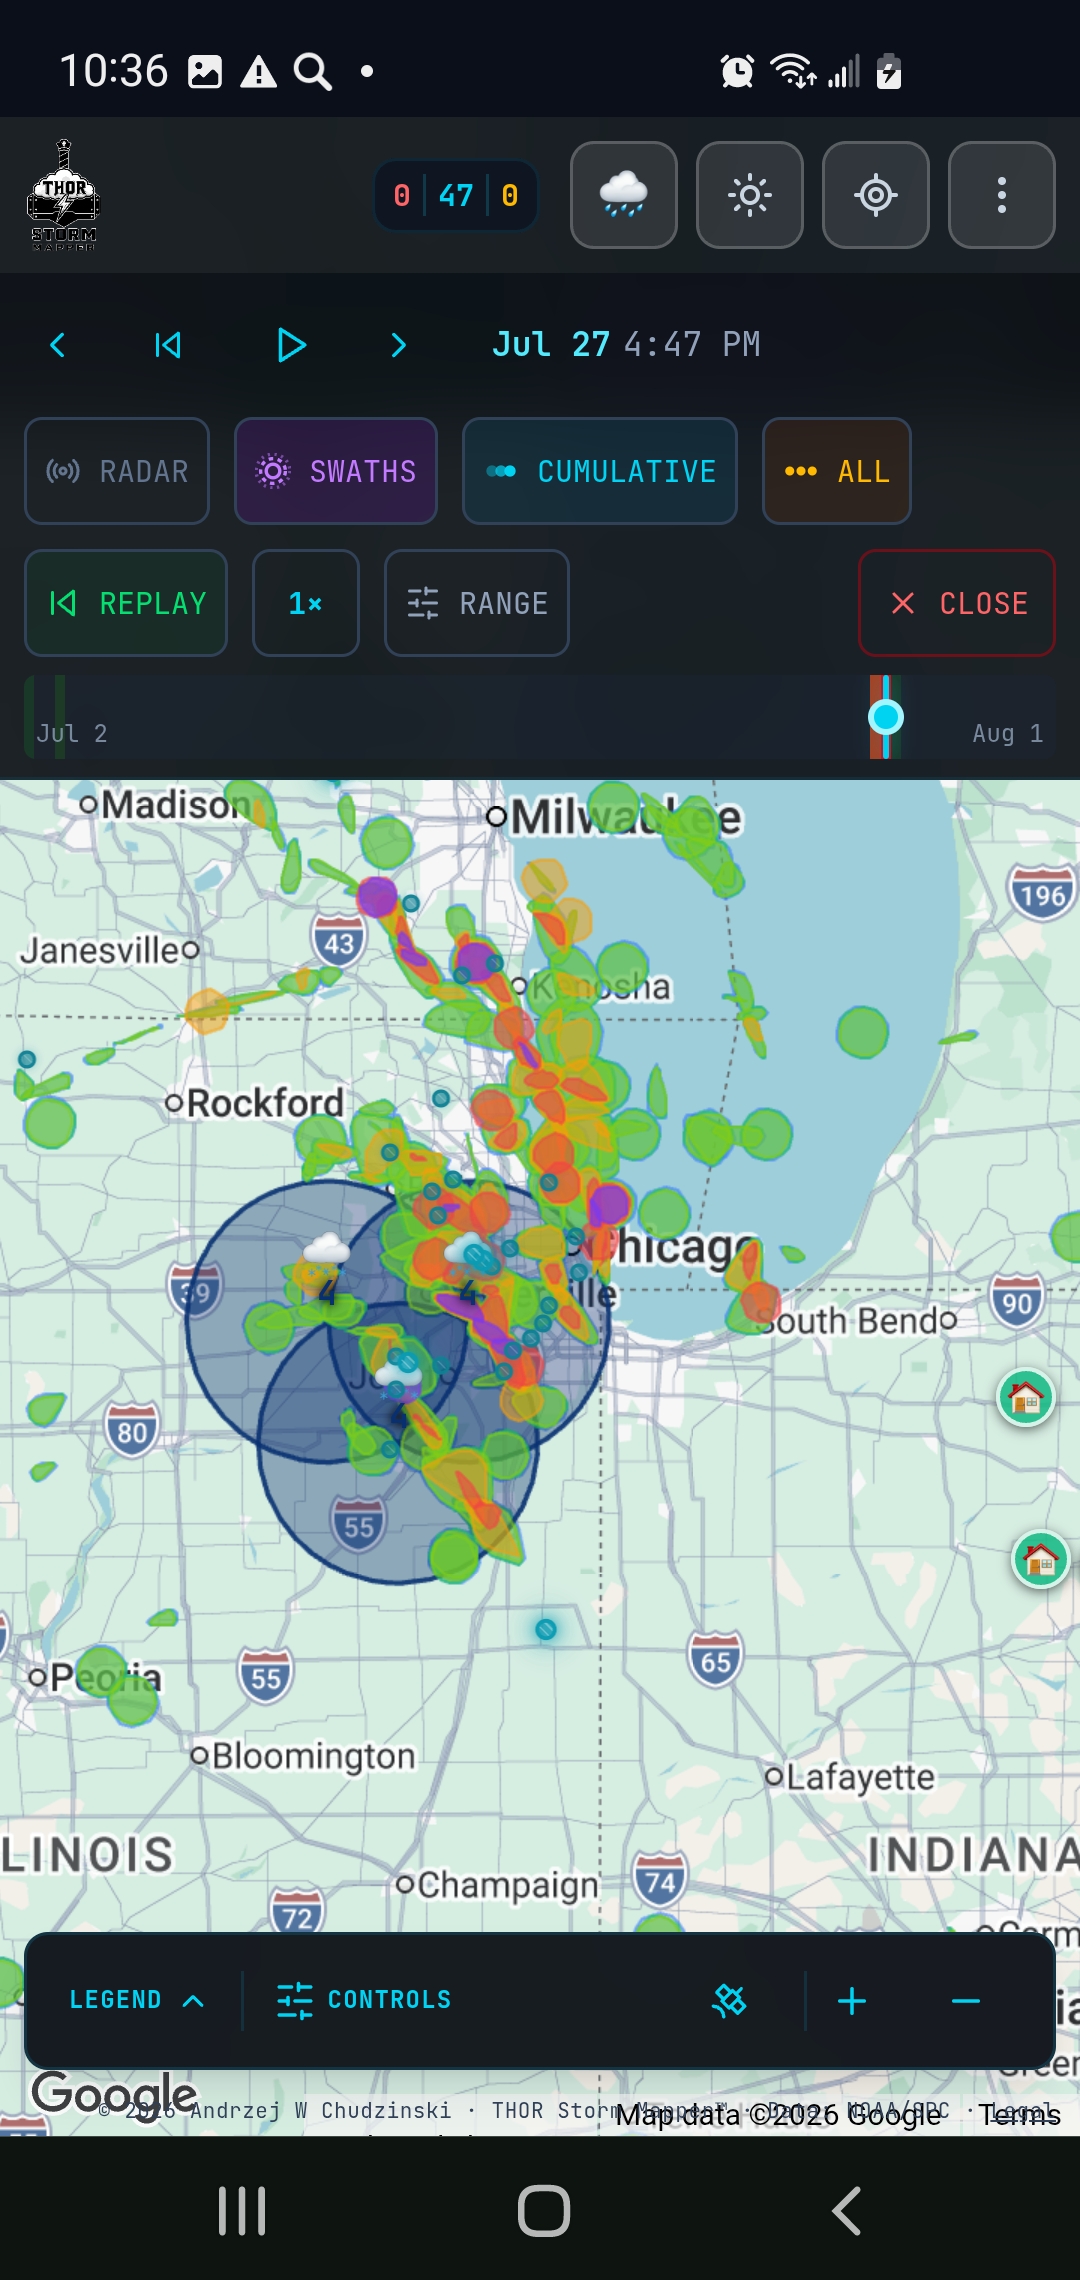
Replay the radar frame by frame as hail swaths and reported events build across the map. Timeline turns the storm record into a clear visual sequence your team can use to choose the next market, explain the damage path, and arrive prepared.

Timeline replay · Hail + radar
Live storm story

One outbreak, from the first map view to the exact event.

STEP 1 / 4

Live Storm Intelligence — July 27, 2026

18 Tornadoes. 35 Hail Reports. One Map. All Live.

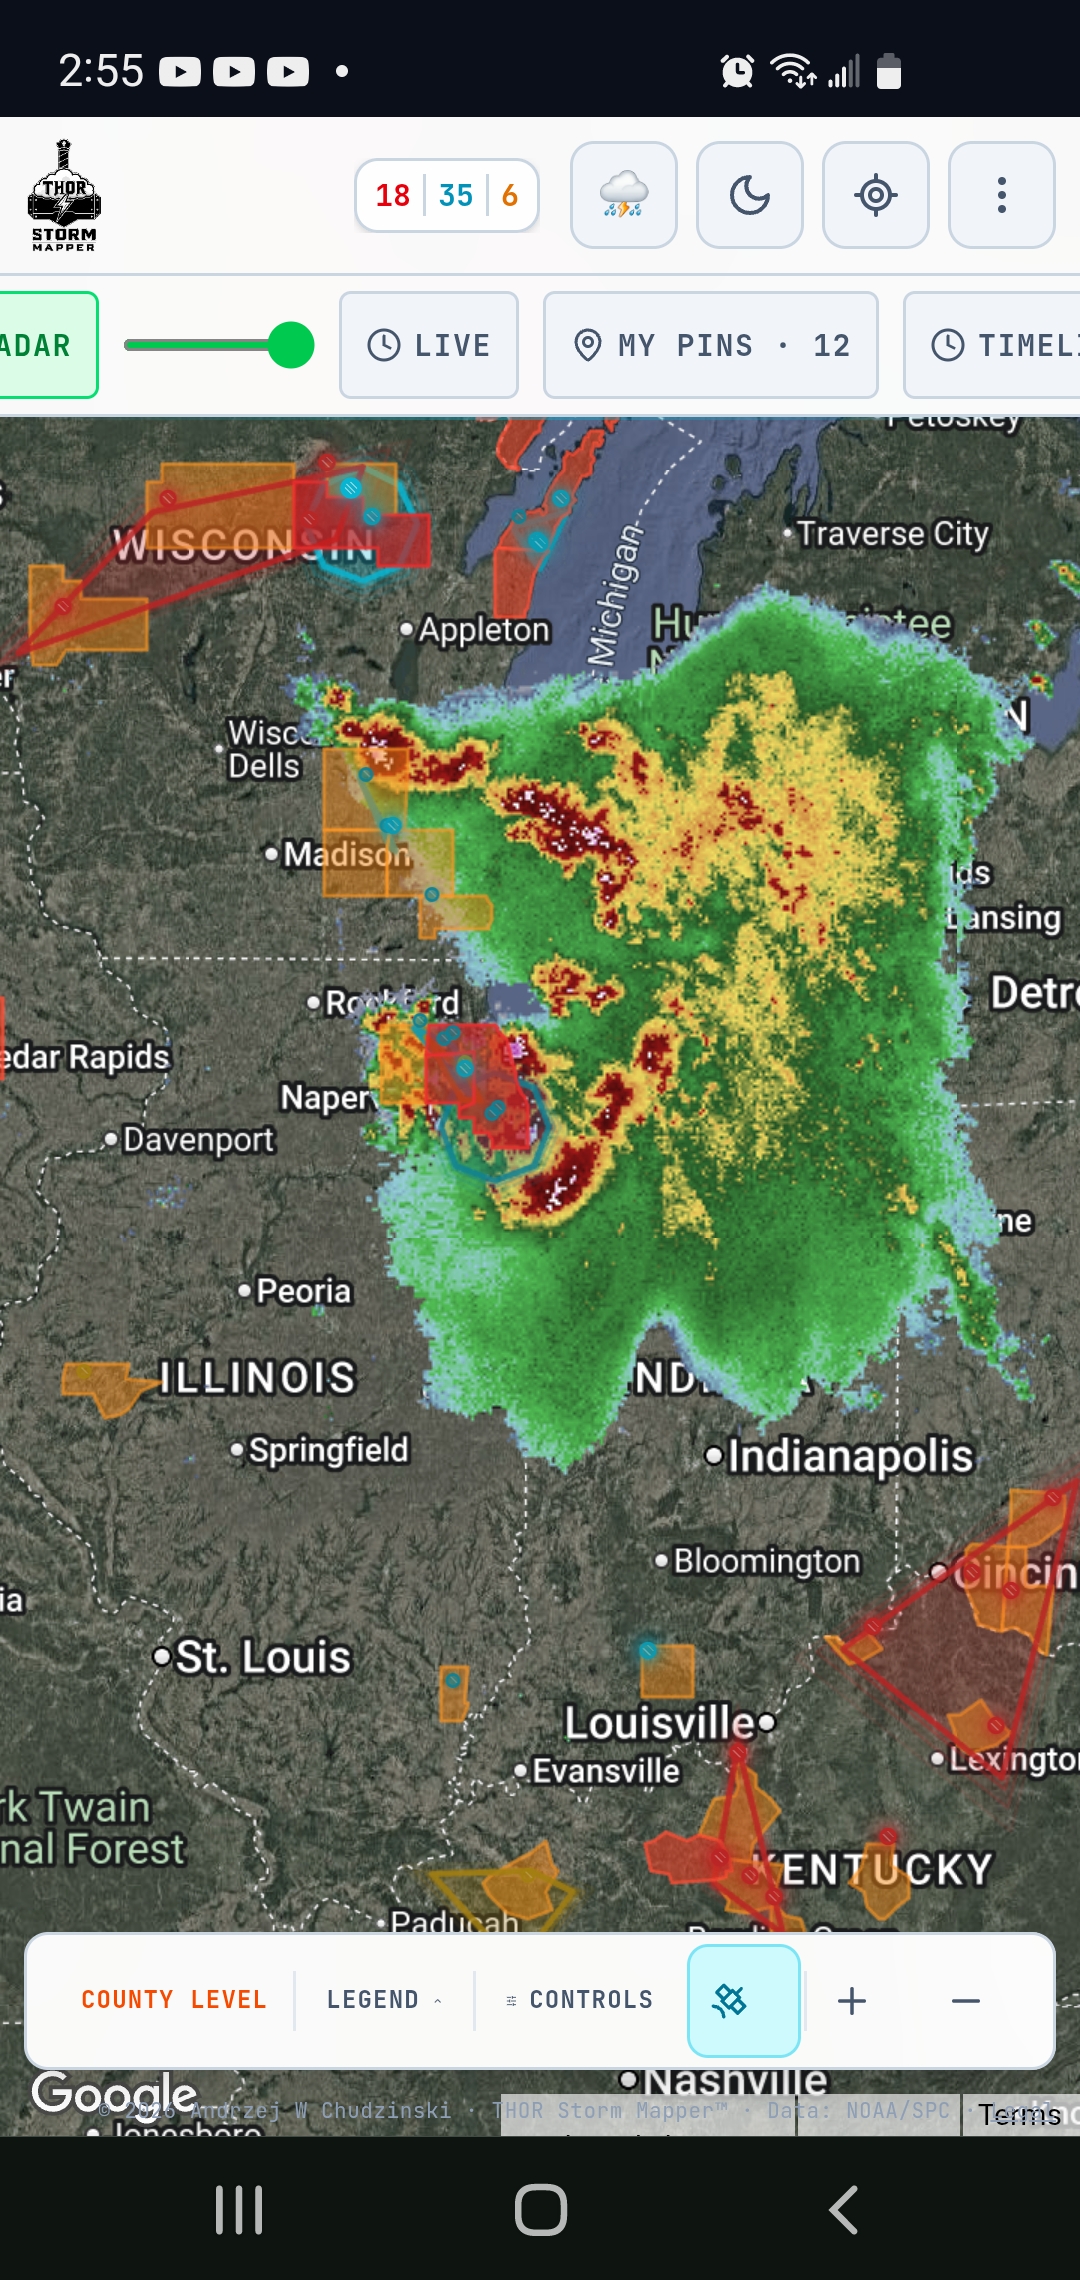
A Great Lakes outbreak captured in real time at 2:55 PM CDT on July 27, 2026. The system header shows 18 tornado reports, 35 hail reports, and 6 wind reports active simultaneously across Wisconsin, Illinois, Indiana, and Kentucky. THOR Storm Mapper was tracking all of it — outbreak polygons drawn, county summaries live, hail markers populating — while the storm was still moving. This is the map open before the last cell clears.

THOR Storm Mapper live Great Lakes storm system with 18 tornadoes and 35 hail reports
National Overview

See Every Storm-Hit Market at a Glance

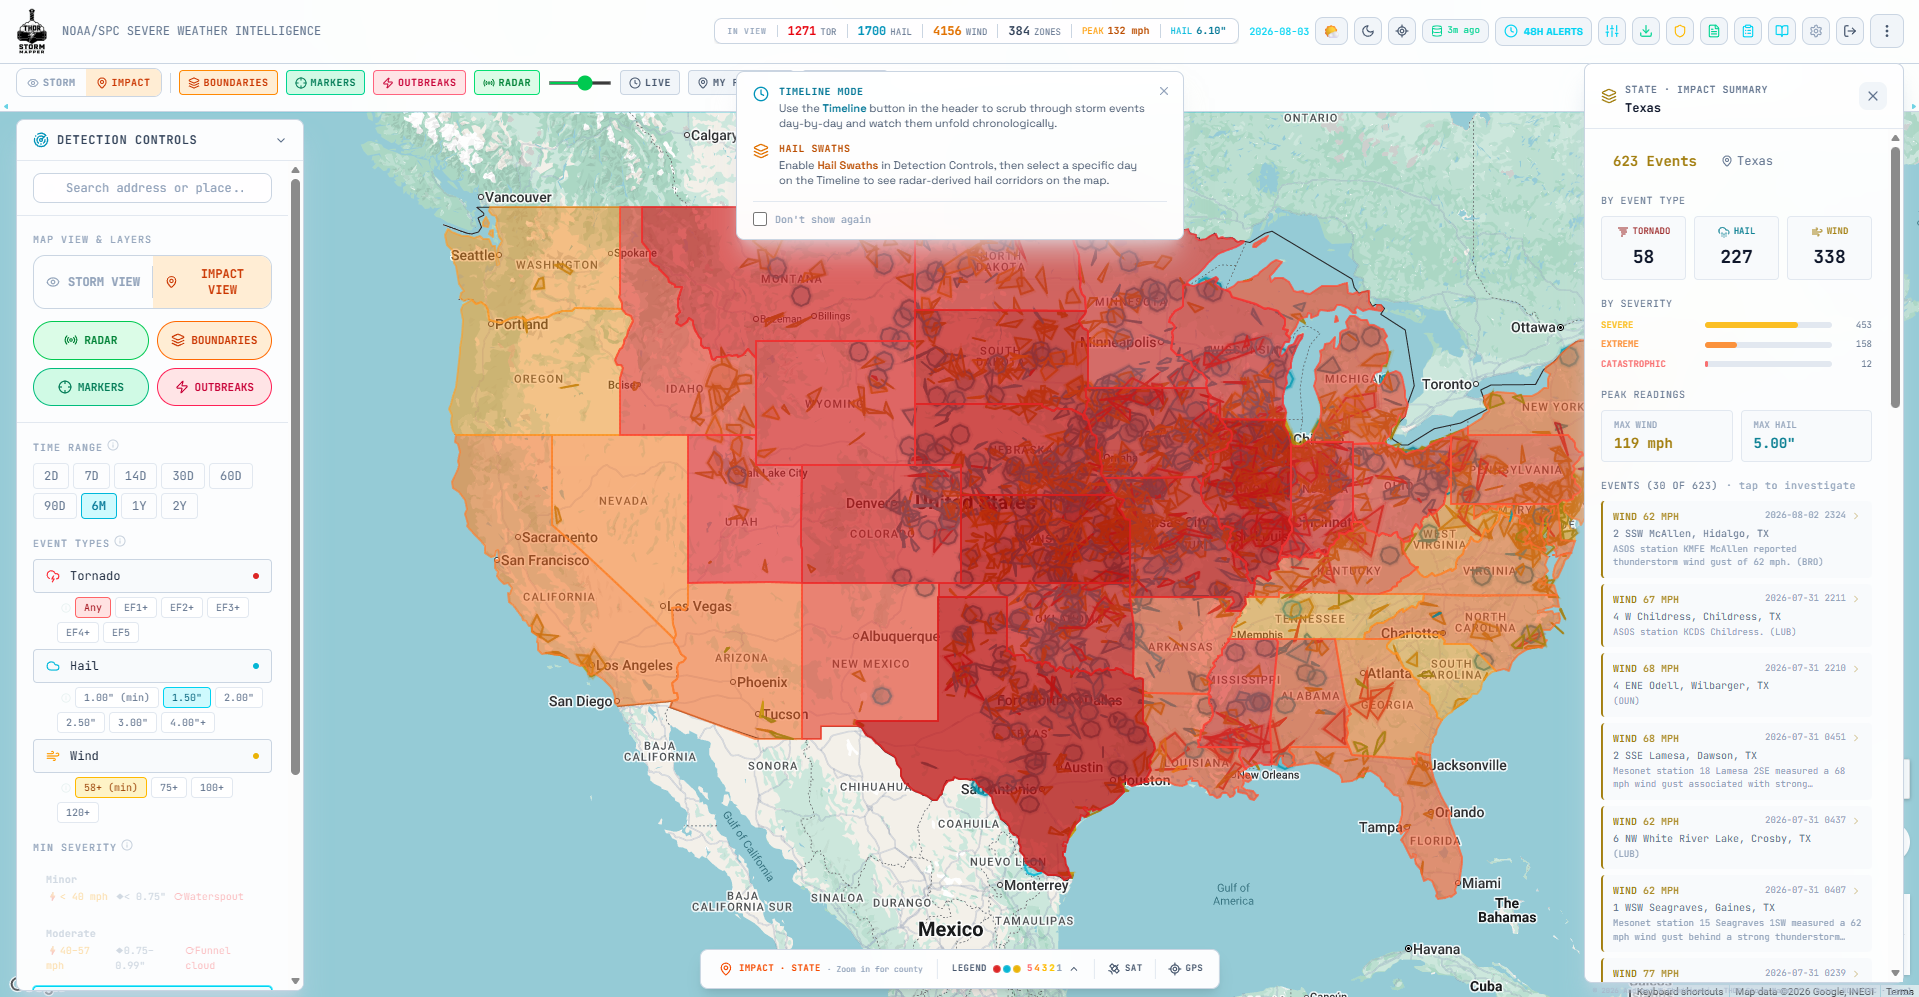
The State Impact View paints the entire country with severity-coded county polygons. Deep red means high-density hail and tornado activity — exactly where roofing demand is surging right now. This screenshot shows the 6-month Texas view: 623 events statewide, 58 tornadoes, 227 hail strikes, 338 wind reports, max hail 5.00", max wind 119 mph. Filter by event type, severity, and time range to zero in on the markets worth chasing. Click any state for an instant breakdown. You'll know which markets to chase before your competition is even awake.

THOR Storm Mapper state-level impact heatmap showing storm severity across the US with Texas impact summary
County Intelligence

Drill Down to the Exact Counties That Need You

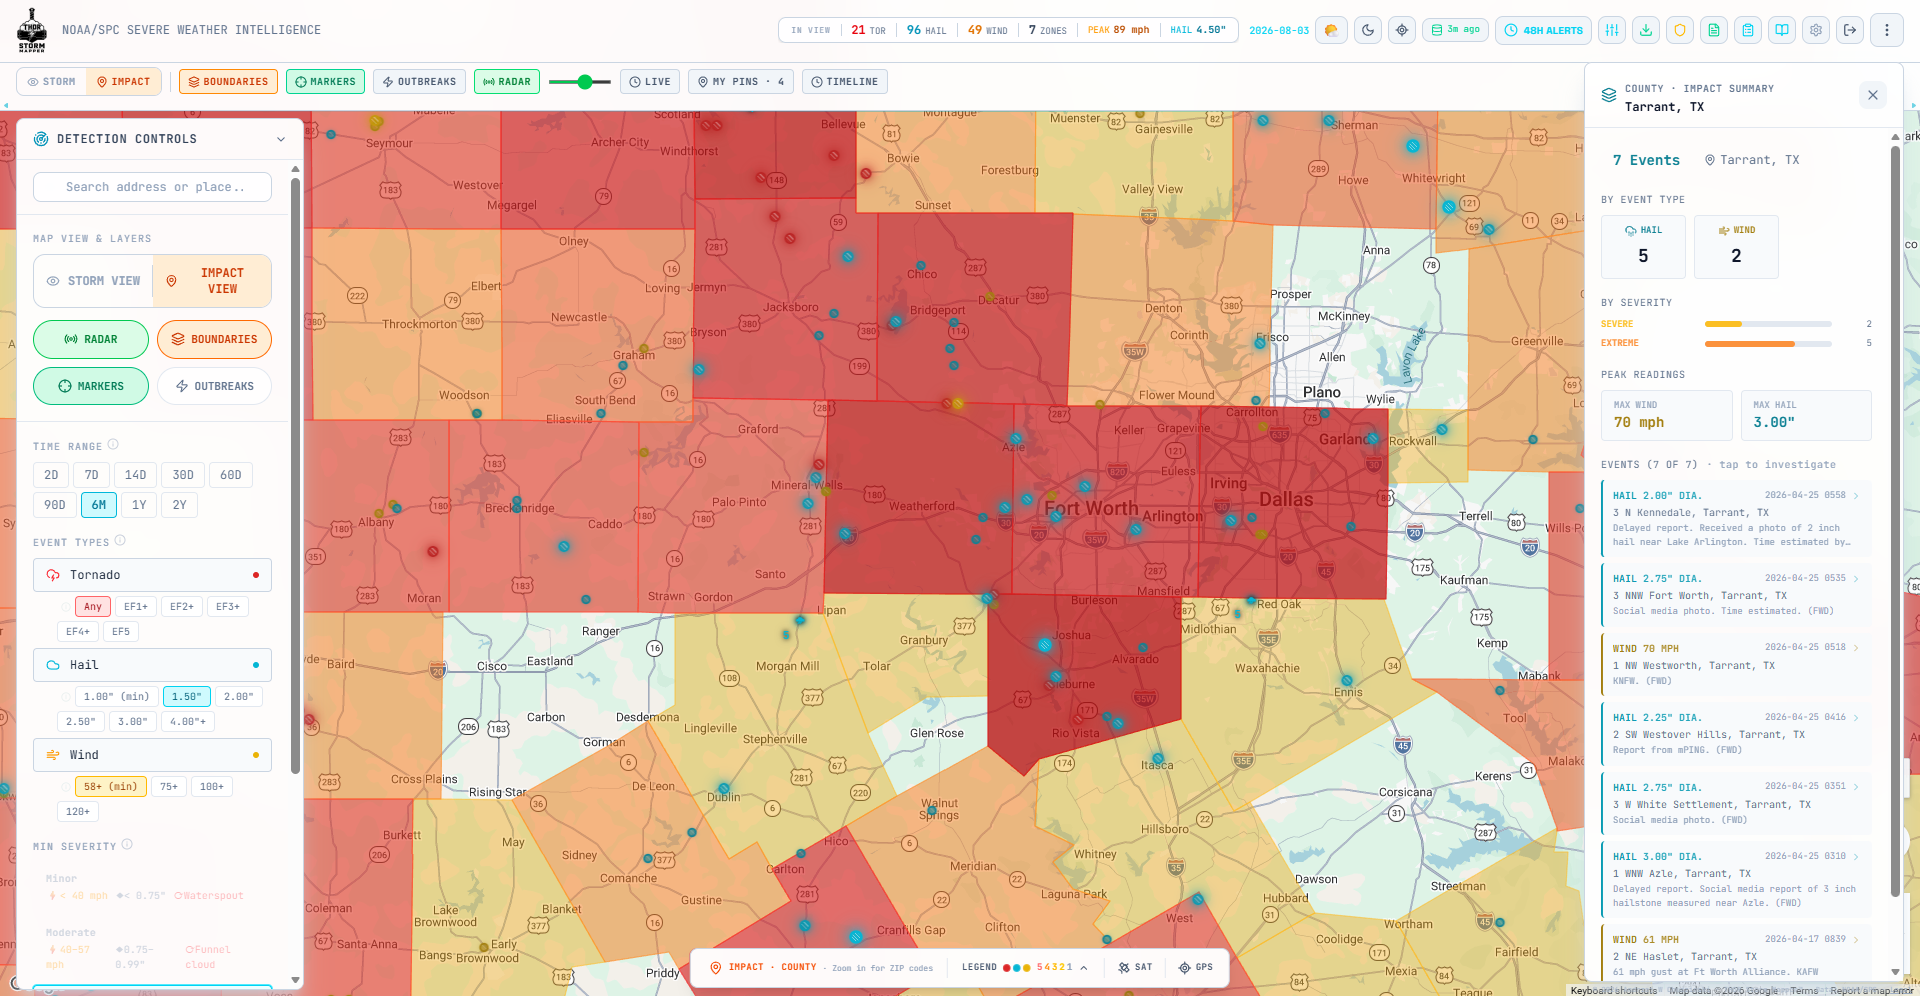
Zoom into county level and THOR breaks down every storm event by type, severity, and peak readings. Tarrant County, TX: 7 events, 5 hail strikes up to 3.00" diameter, 2 wind reports peaking at 70 mph. The event list shows exact locations, timestamps, and NWS field reports — including a 3" hailstone measured in Azle and 2.75" reports from Fort Worth and White Settlement. Prioritize your canvassing route before you even leave the truck.

THOR Storm Mapper county impact summary showing Tarrant County TX storm breakdown with hail and wind events
Outbreak Intelligence + Canvassing Context

See the Swath, the Event Record, and the Next Move in One View

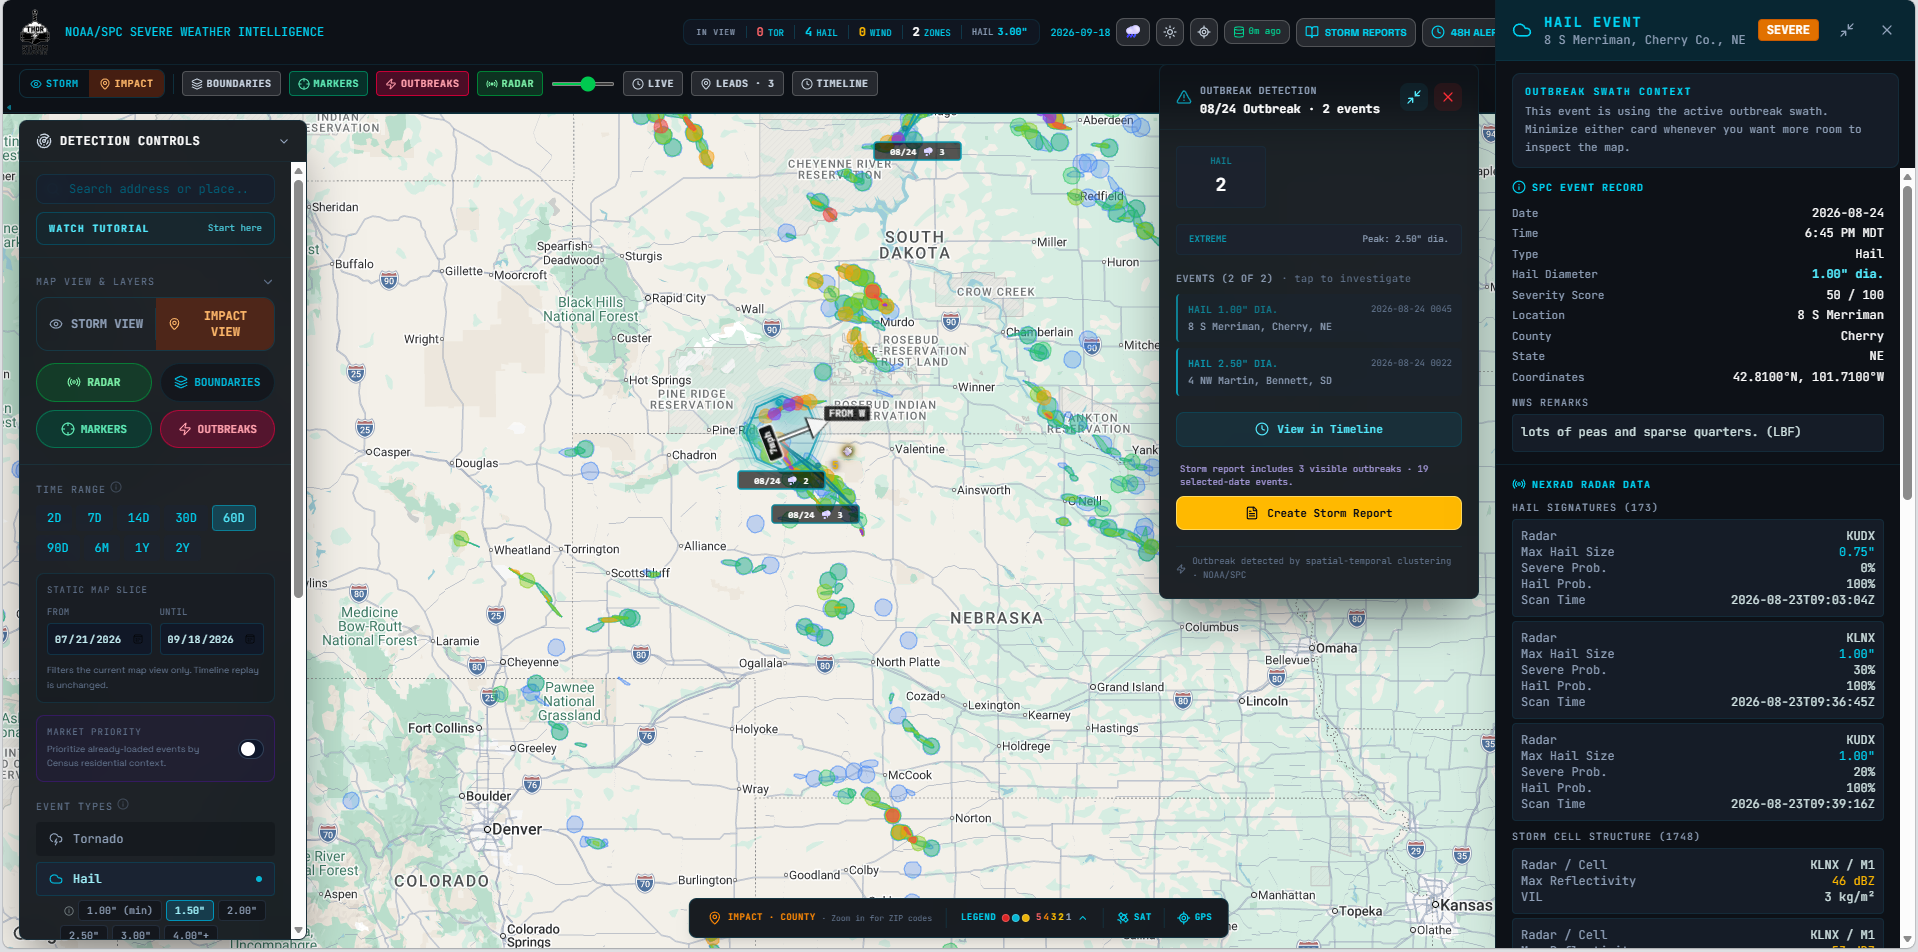
This live THOR view puts the entire storm picture in front of you: the active hail swath, clustered event dots, outbreak context, and the detailed record for an 8 S Meridian, Nebraska hail report. See the reported 1.00" hail size, exact location, NWS remarks, radar hail signatures, and storm-cell readings without leaving the map. From the same outbreak panel, open the timeline to replay the storm or create a Storm Report for the visible system. It is the field context that helps you choose where to canvass next and walk up to the right door prepared.

THOR Storm Mapper active outbreak view near Meridian Nebraska showing hail swaths, event details, NEXRAD radar data, timeline control, and Create Storm Report action
One-Tap Navigation

Drive There Instantly — No Copy-Pasting Coordinates

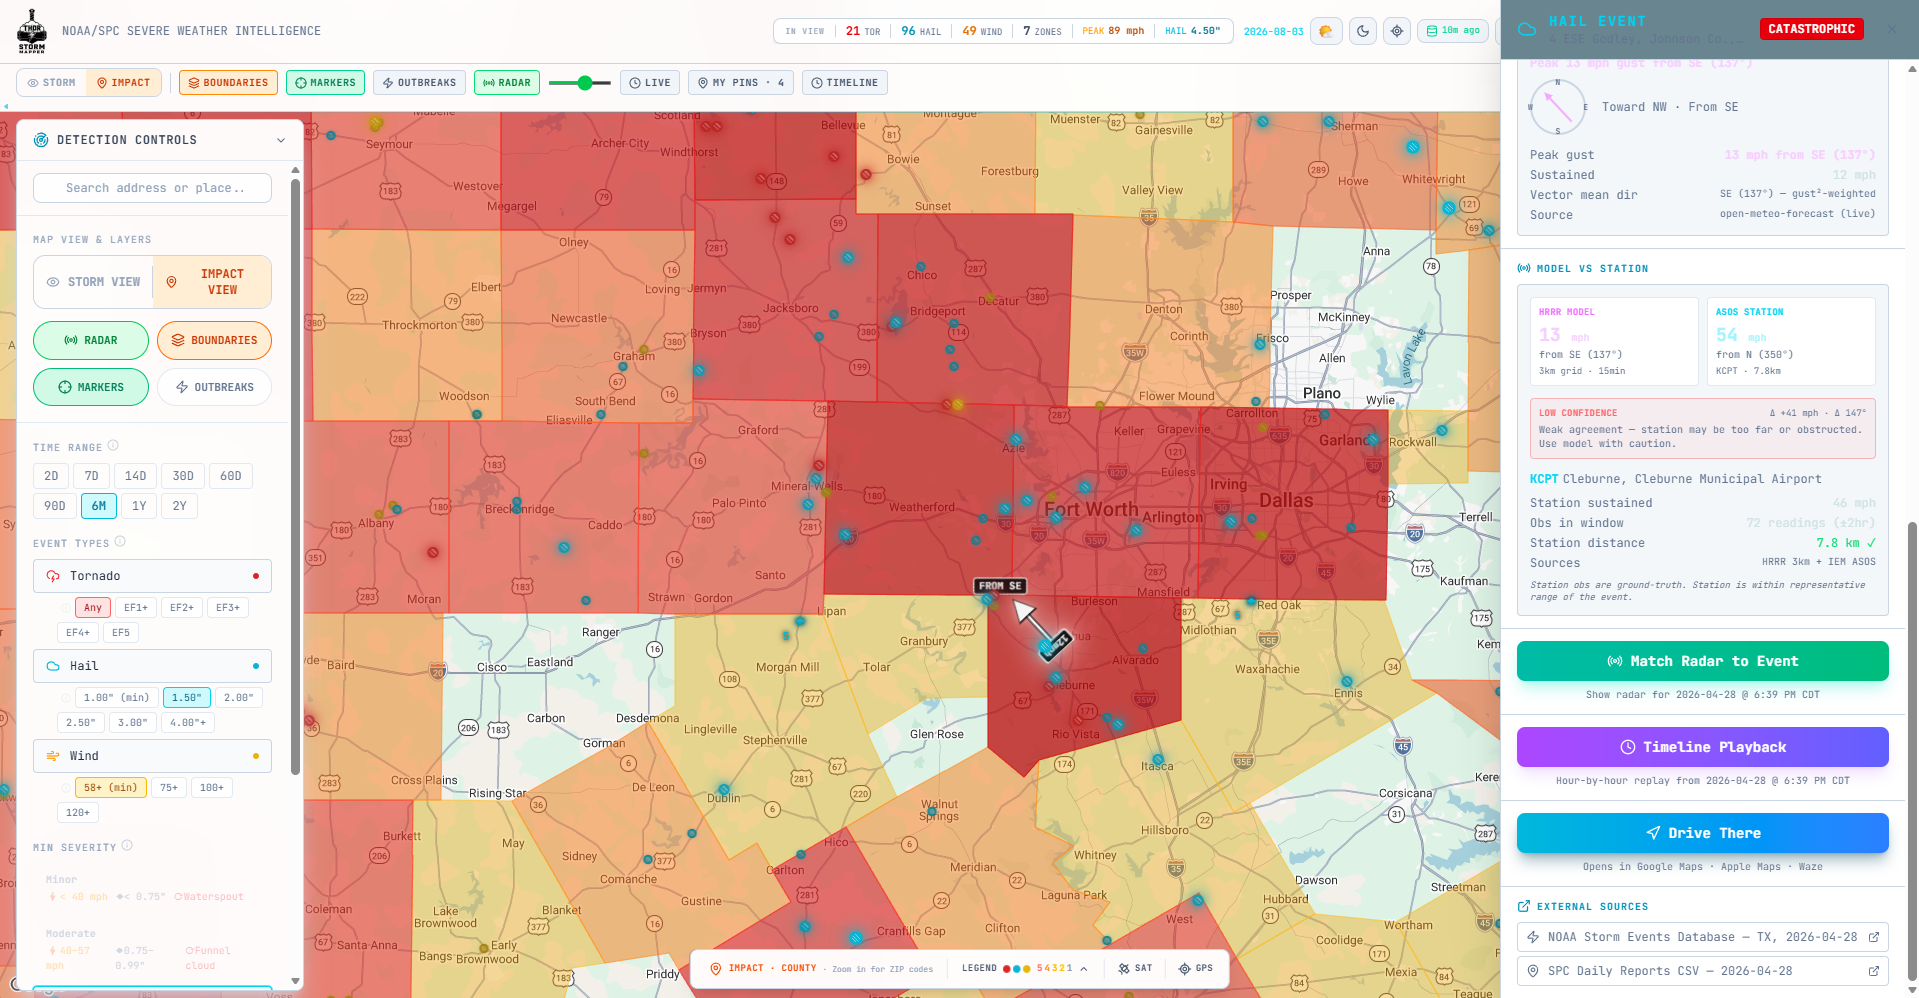
Found a high-severity event? Hit Drive There and your phone opens Google Maps, Apple Maps, or Waze with turn-by-turn directions to the exact storm coordinates. This event — 4 ESE Godley, Johnson County, TX — is a CATASTROPHIC 4.50" hail strike with a peak gust of 33 mph from SE. HRRR model and ASOS station data are cross-referenced so you know exactly what hit. One tap and you're routed. No switching apps, no typing addresses, no wasted time while your competition is already knocking doors.

THOR Storm Mapper Drive There button on a CATASTROPHIC hail event detail panel showing wind verification and model vs station data

Everything you see above is live data from NOAA and the Storm Prediction Center.

Start Free Trial — 14 Days, No Card →

Featured field walkthrough

See Market Priority in action

Follow a real Chicago-area storm workflow from reported events to a clearer residential market decision. Use the player controls to hear the walkthrough.

Market Priority walkthrough

A six-minute walkthrough of Market Priority. Turn on the sound in the player if you’d like to follow along.

Start here

THOR Storm Mapper — Market Priority Walkthrough

Market Priority helps your team compare the storm-affected areas already on the map with available household, residential-density, population, and Residential Score context. The weather evidence stays intact; this simply helps you decide where to investigate first.

  • •Choose the housing or population lens that fits the market you work.
  • •Narrow prepared results to the top 50%, 25%, or 10% when appropriate.
  • •Use the same workflow on desktop, tablet, or phone.

Market Priority supports market research and inspection planning. It does not verify property damage, qualify a property, or establish a claim outcome.

New Feature

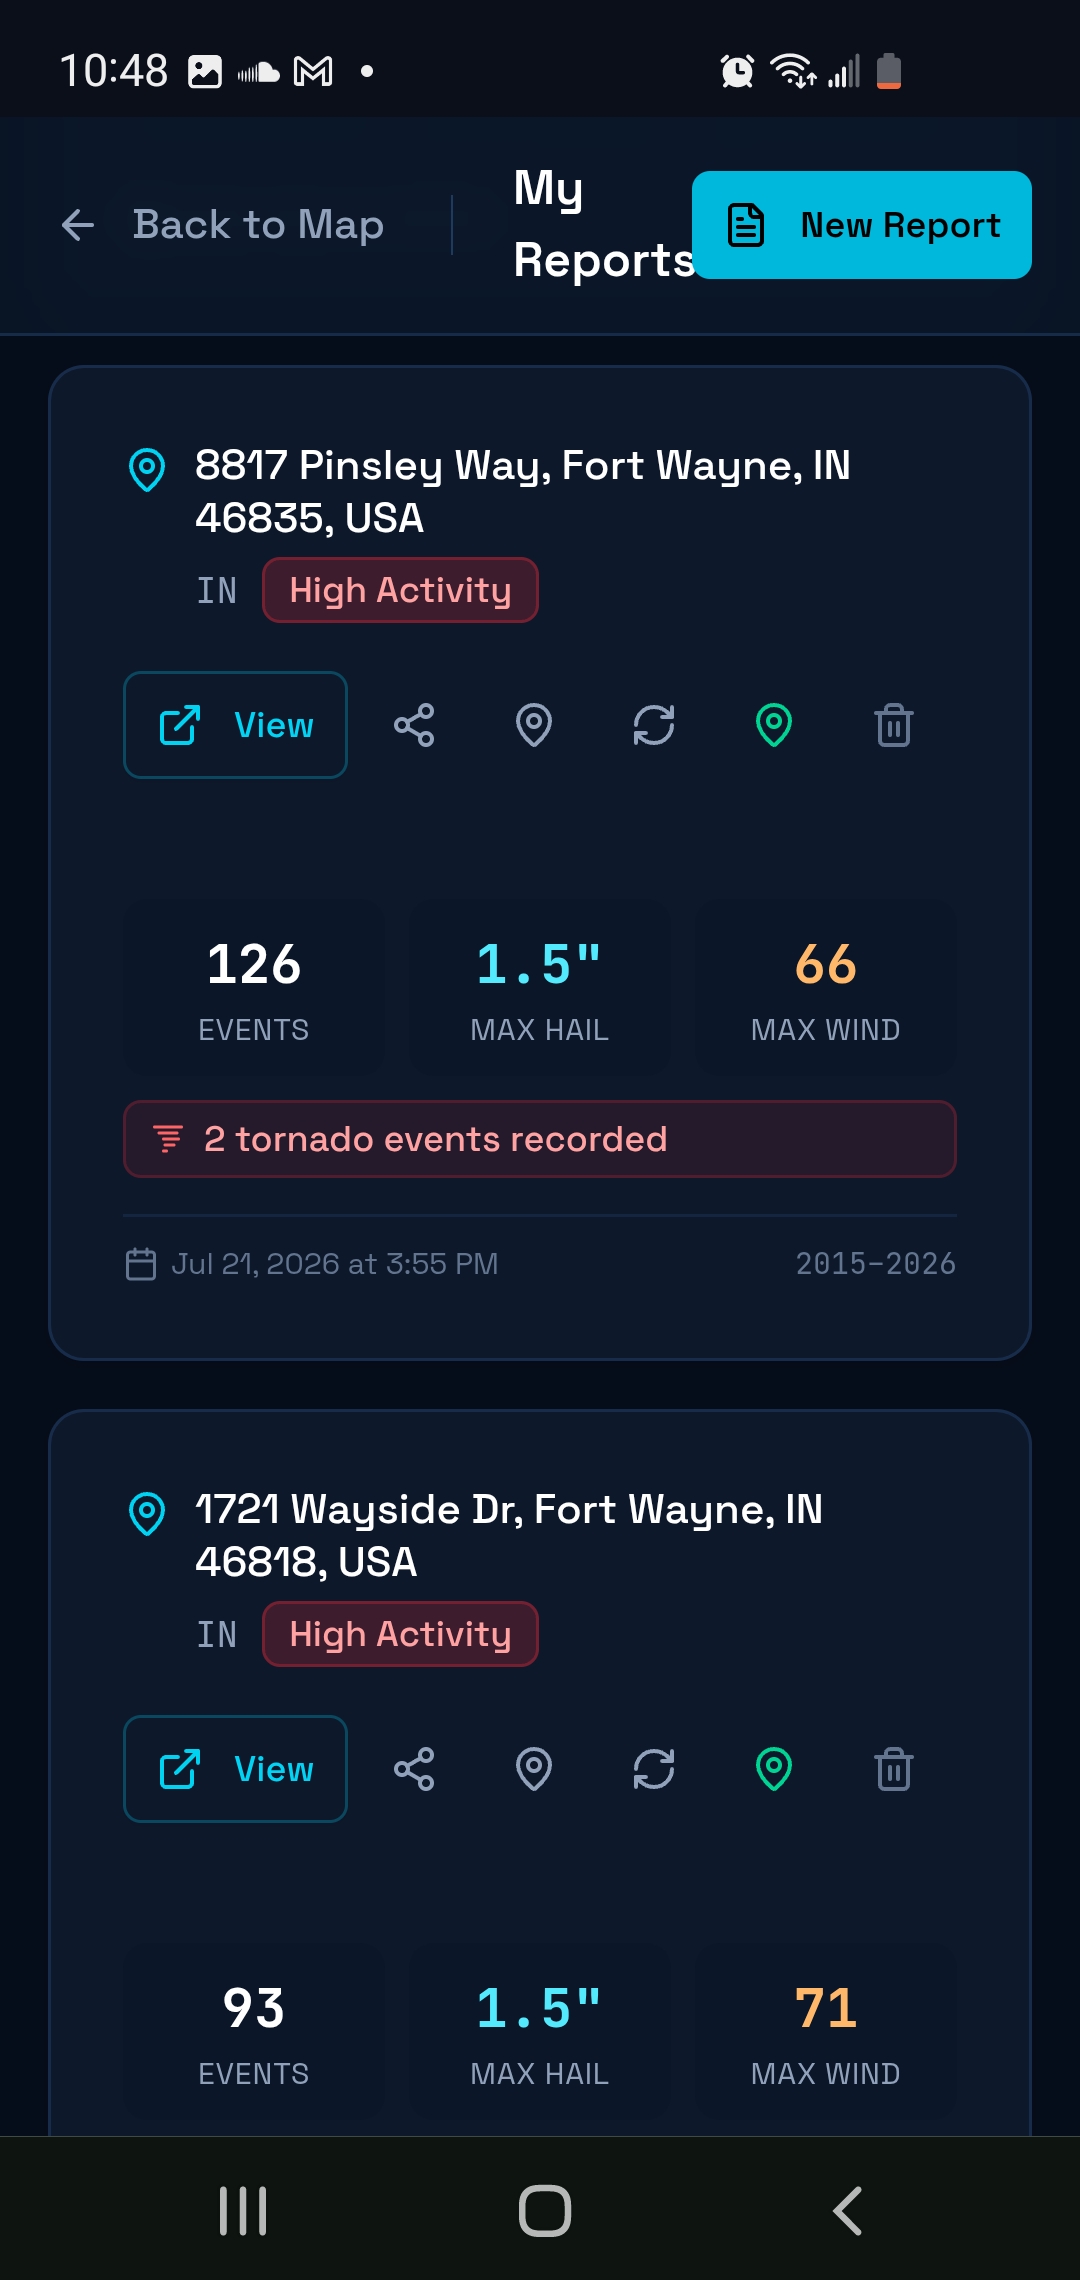
Your Personal Storm Report Library

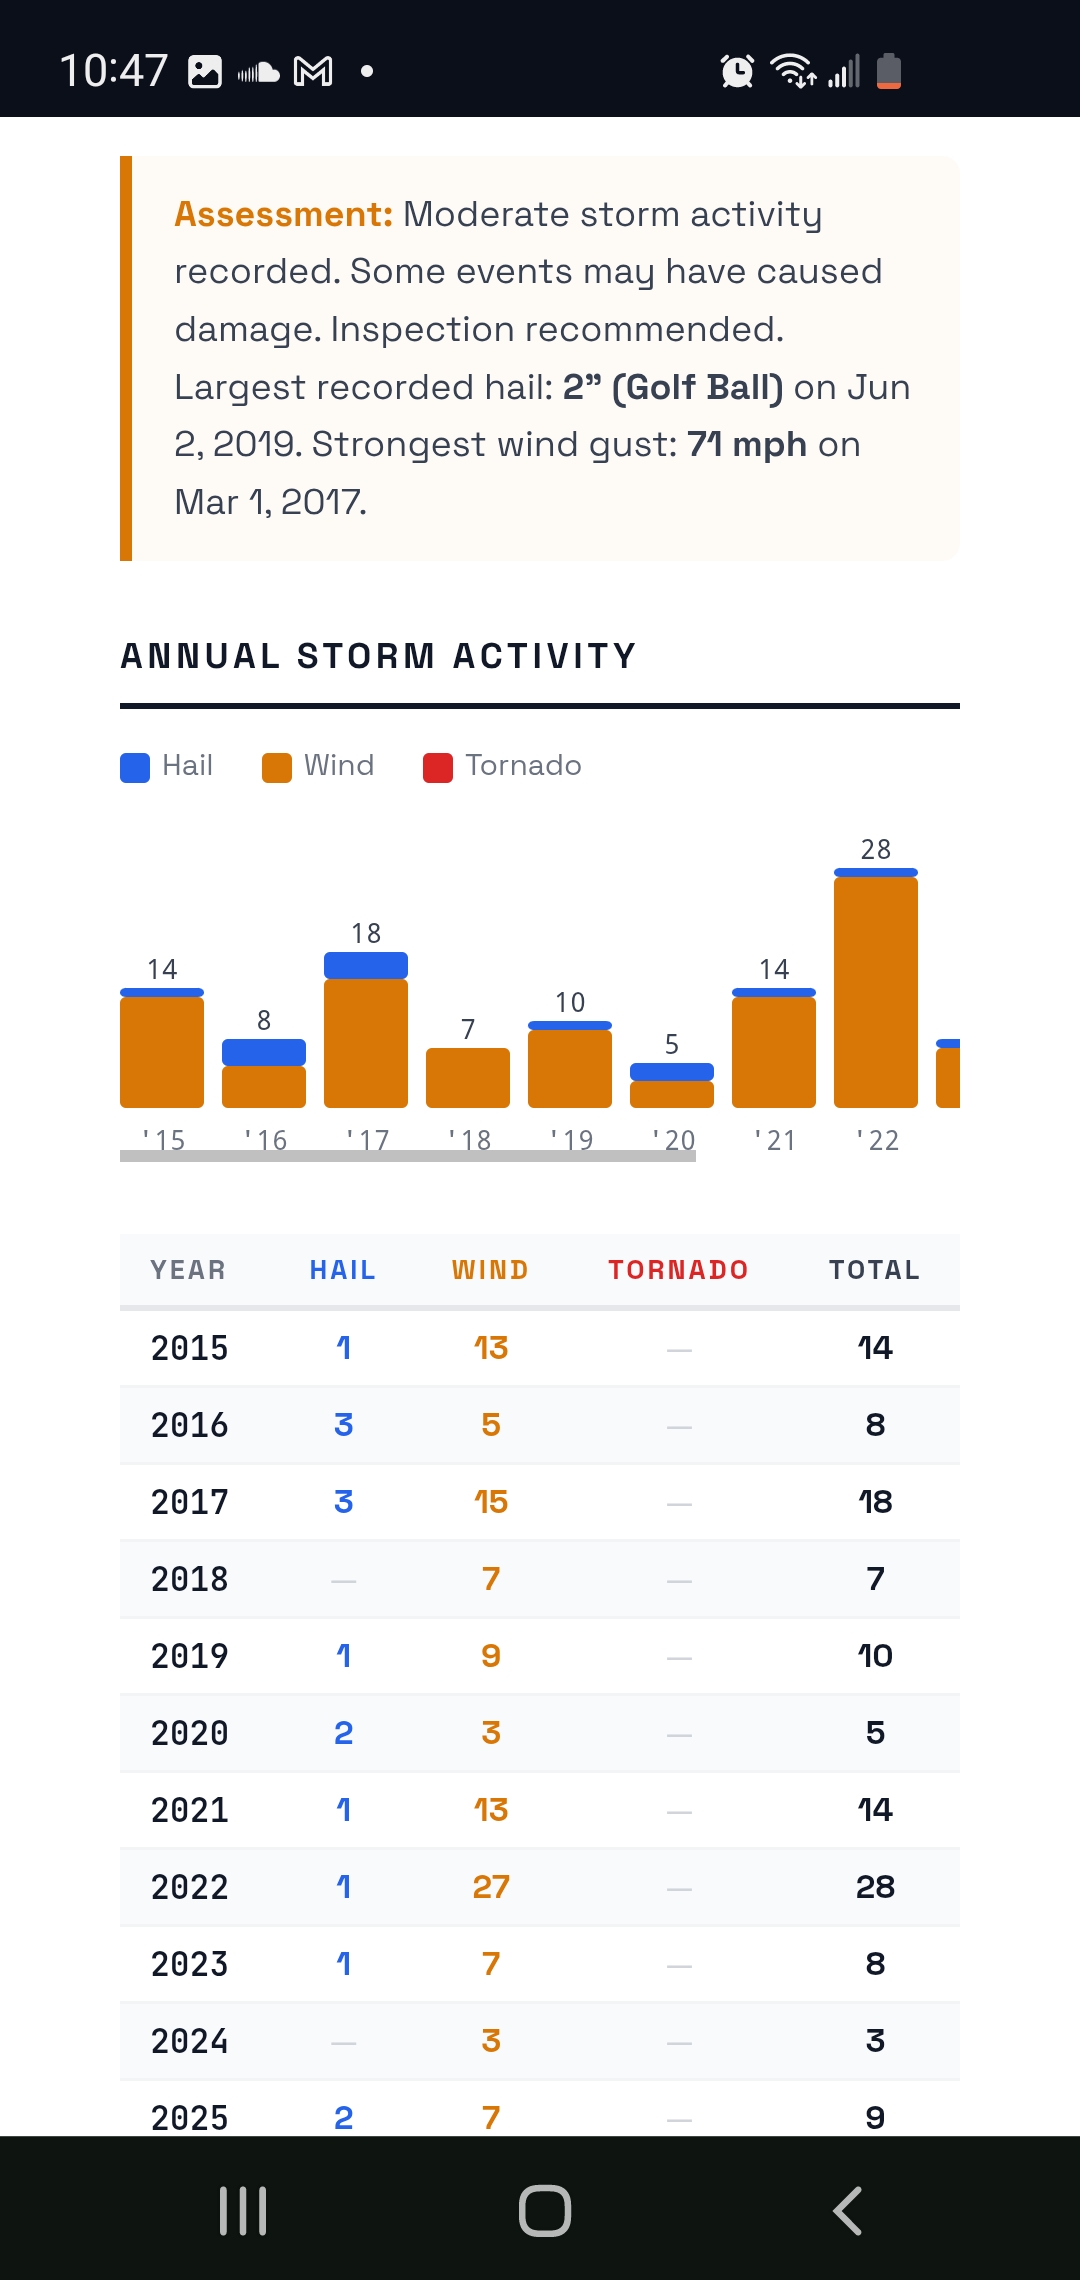
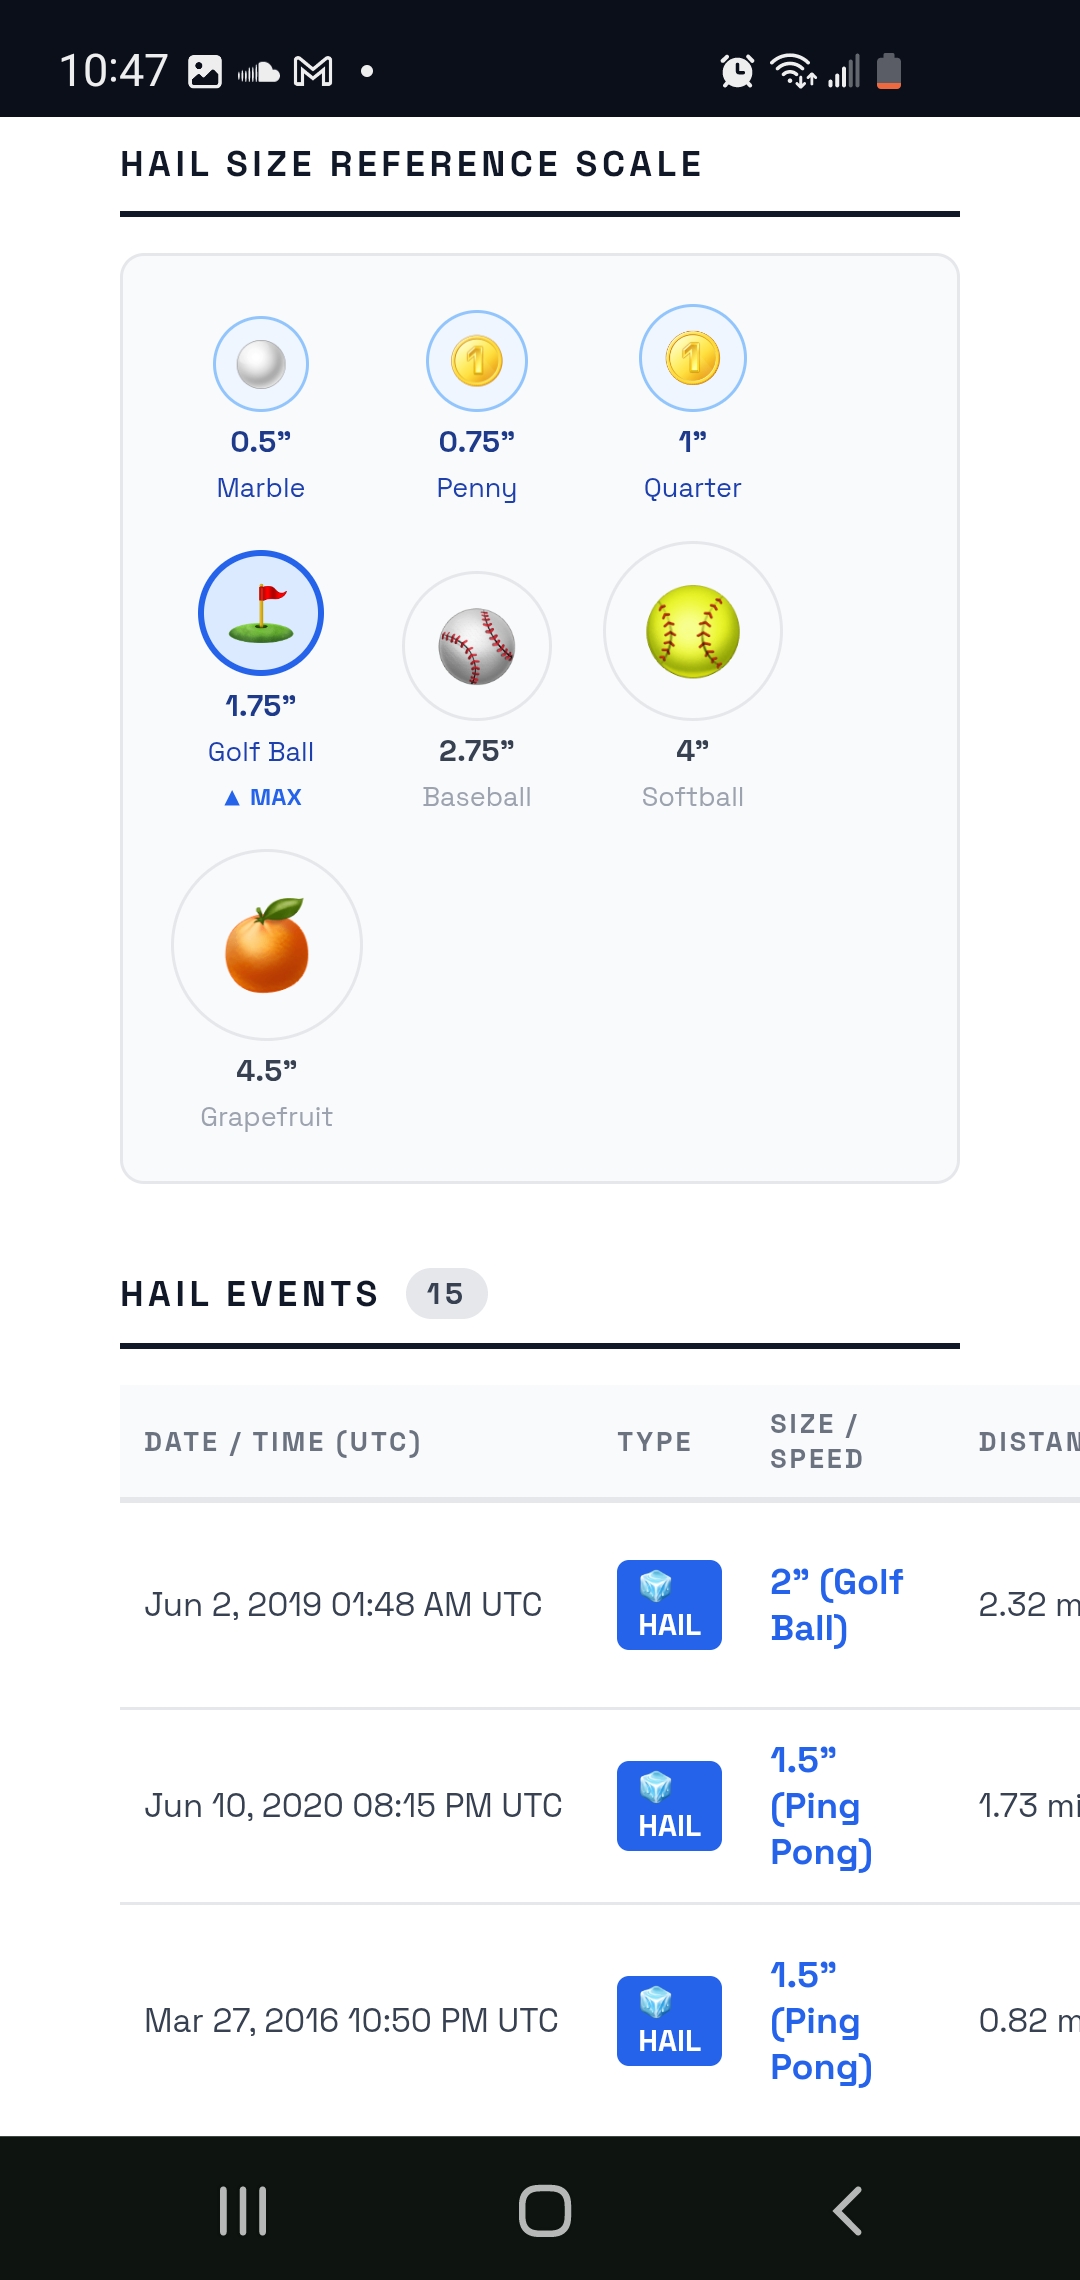
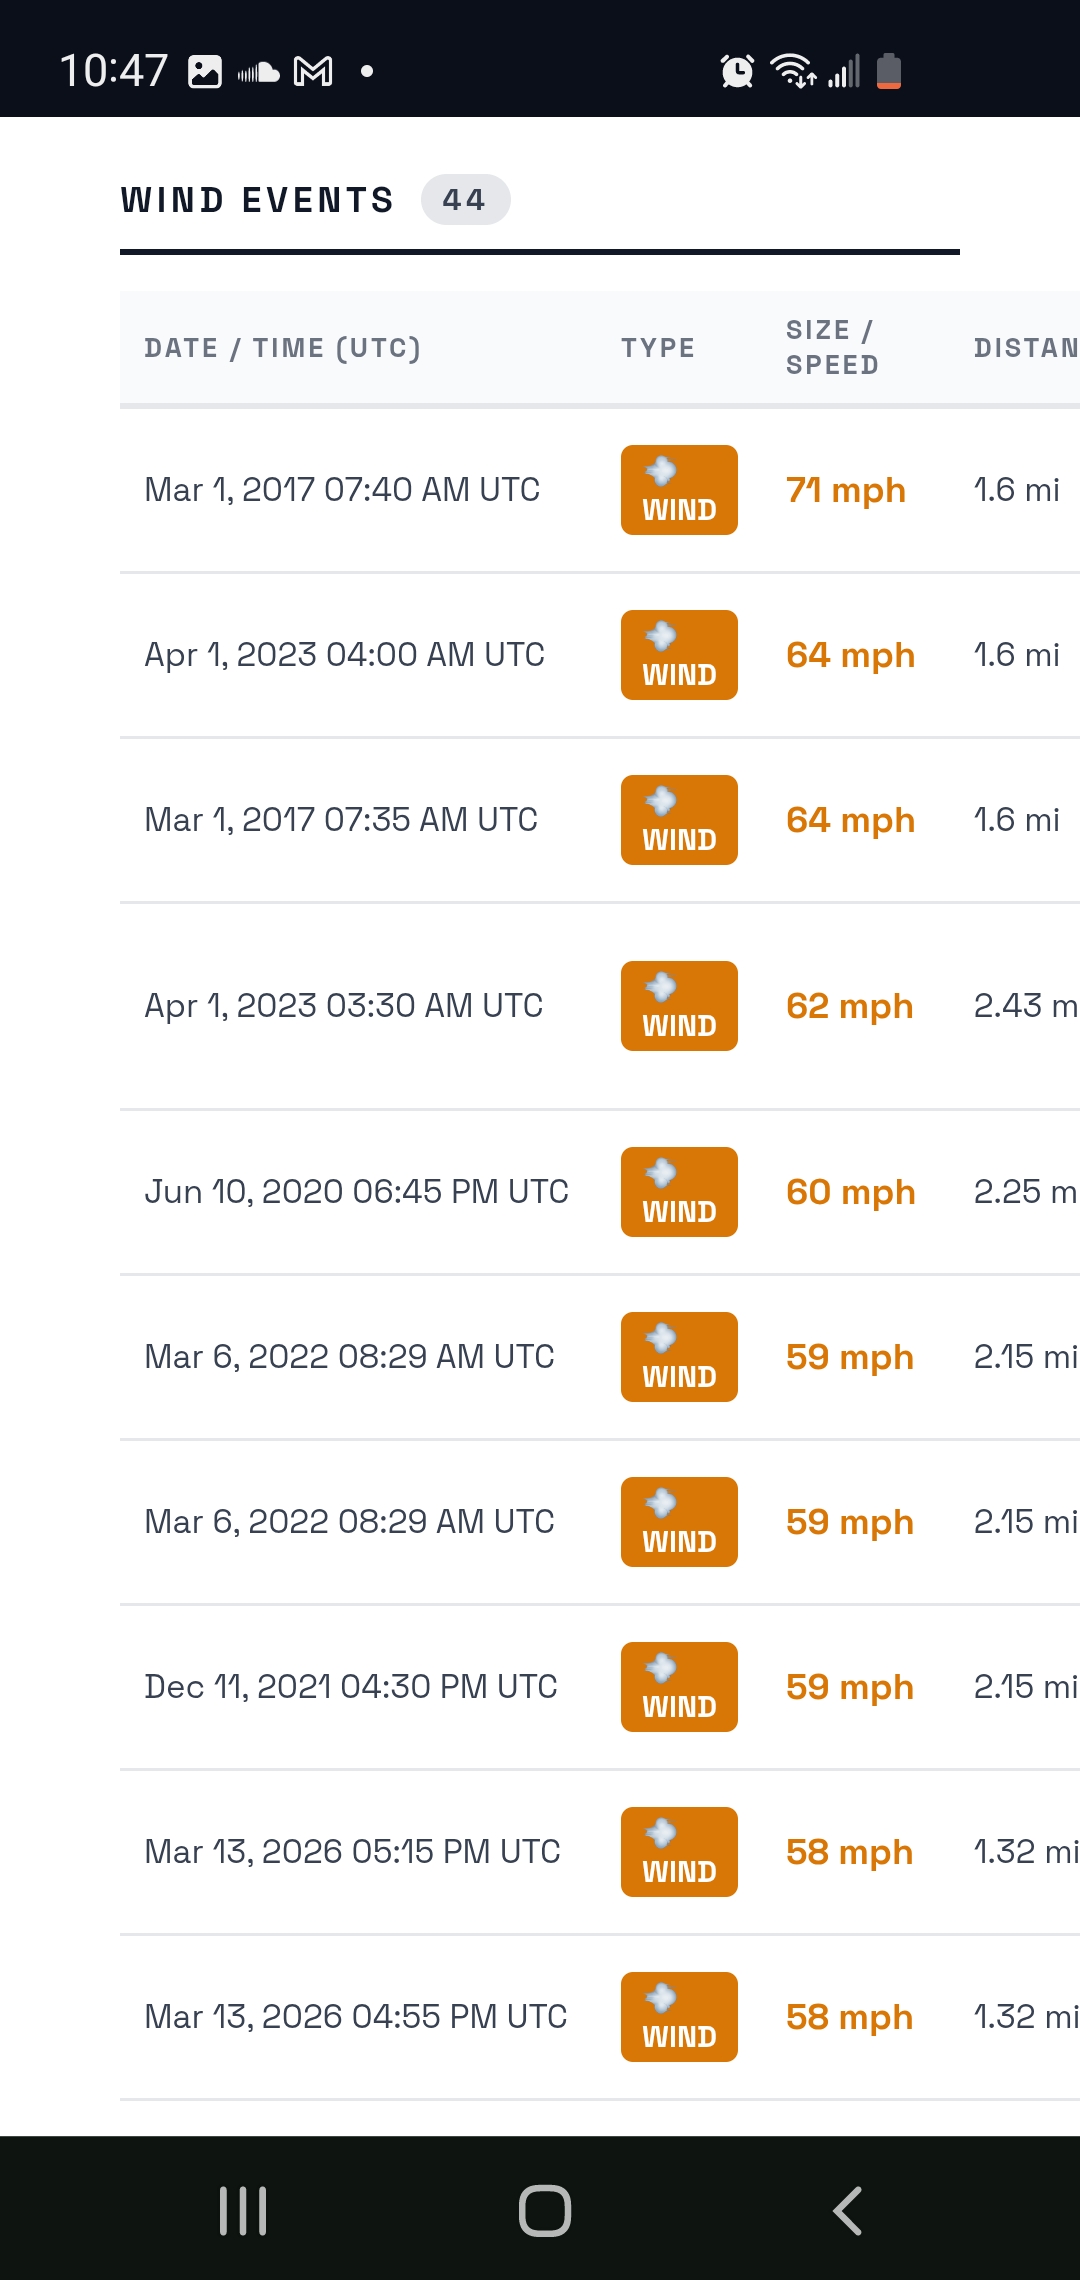
Generate a one-click property storm history for any address — every NOAA-verified hail event, tornado, and wind record within 1 mile, going back to 2014. Every report is automatically saved to your account. Re-download it tomorrow, share it with a homeowner next week, or pull it up during a claim review six months from now. Your entire report library, always at your fingertips.

Annual Storm Activity Chart

Annual Storm Activity Chart

🏠 Who Uses Property Storm History Reports

Roofing Contractors

Pull up the storm history for a prospect's address before you knock on their door. Walk in with the exact date, hail size, and event type already in hand — and close the job before your competitor even gets there.

Public Adjusters

Build a thorough storm documentation file in minutes. Every report includes NOAA-verified event records with lat/lon, magnitude, and event type — the same data that insurance carriers and adjusters use when evaluating storm damage.

Homeowners

Not sure if your roof was damaged? Run your own address and see every storm that hit within a mile since 2014. Know what happened, when it happened, and how severe it was — before you call a contractor or file a claim.

Real Estate Professionals

Disclose storm history with confidence. Generate a report for any property you're listing or buying, and keep it on file for due diligence, disclosure, or future reference.

📋 What You Get

📍

Address-Level Precision

Every storm event within 1 mile of the exact address, not just the county or ZIP. Distance from the property is shown for every event.

📅

10+ Years of NOAA History

Data going back to 2014 from the National Weather Service Storm Data archive. Hail size, wind speed, EF rating, date, time, and source — all in one document.

💾

Saved to Your Account — Forever

Every report you generate is stored in your personal library. Re-download the PDF anytime, for any property, without regenerating. Manage your library from My Reports — delete old ones, re-run updated ones.

📄

Professional PDF Format

Clean, branded report ready to hand to a homeowner, adjuster, or insurance carrier. Includes event summary, max hail size, max wind speed, tornado count, and a full chronological event log.

⚡

One Click. Instant Results.

Type an address, hit Generate. Your report is ready in seconds. No forms to fill, no waiting for a callback, no subscription upgrade required.

Included with every THOR subscription — no add-ons, no per-report fees.

New Feature

Move Storm Data and Team Leads

Send filtered storm events to the tools your team already uses, then bring a lead list into THOR or take the shared team list back out when needed. Storm CSV and KML exports carry the weather evidence; Business Team owners control the organization’s lead import and export.

🗺️

Filtered Storm Data

Select a state and export the hail, tornado, and wind events that match your chosen time range, event types, and minimum severity.

⚡

CSV or KML for Your Workflow

Use CSV in CoreLogic, SalesRabbit, Spotio, Excel, or a CRM. Use KML in NearMap or Google Earth to review color-coded storm evidence on an aerial view.

📥

Bring Leads Into THOR

Business Team owners can import a lead CSV into the shared pool, preserving usable contact, address, status, and coordinate data for the field workflow.

📤

Owner-Managed Lead Import and Export

When a business owner needs a backup or another system, they can export the whole team list when needed. Reps retain their own lead permissions; the owner controls organization data movement.

Storm data: NearMap · CoreLogic · SalesRabbit · Spotio · Google Earth · Excel · CRM and GIS tools · Team leads: owner-managed CSV import and export

Mobile-First Design1 / 9
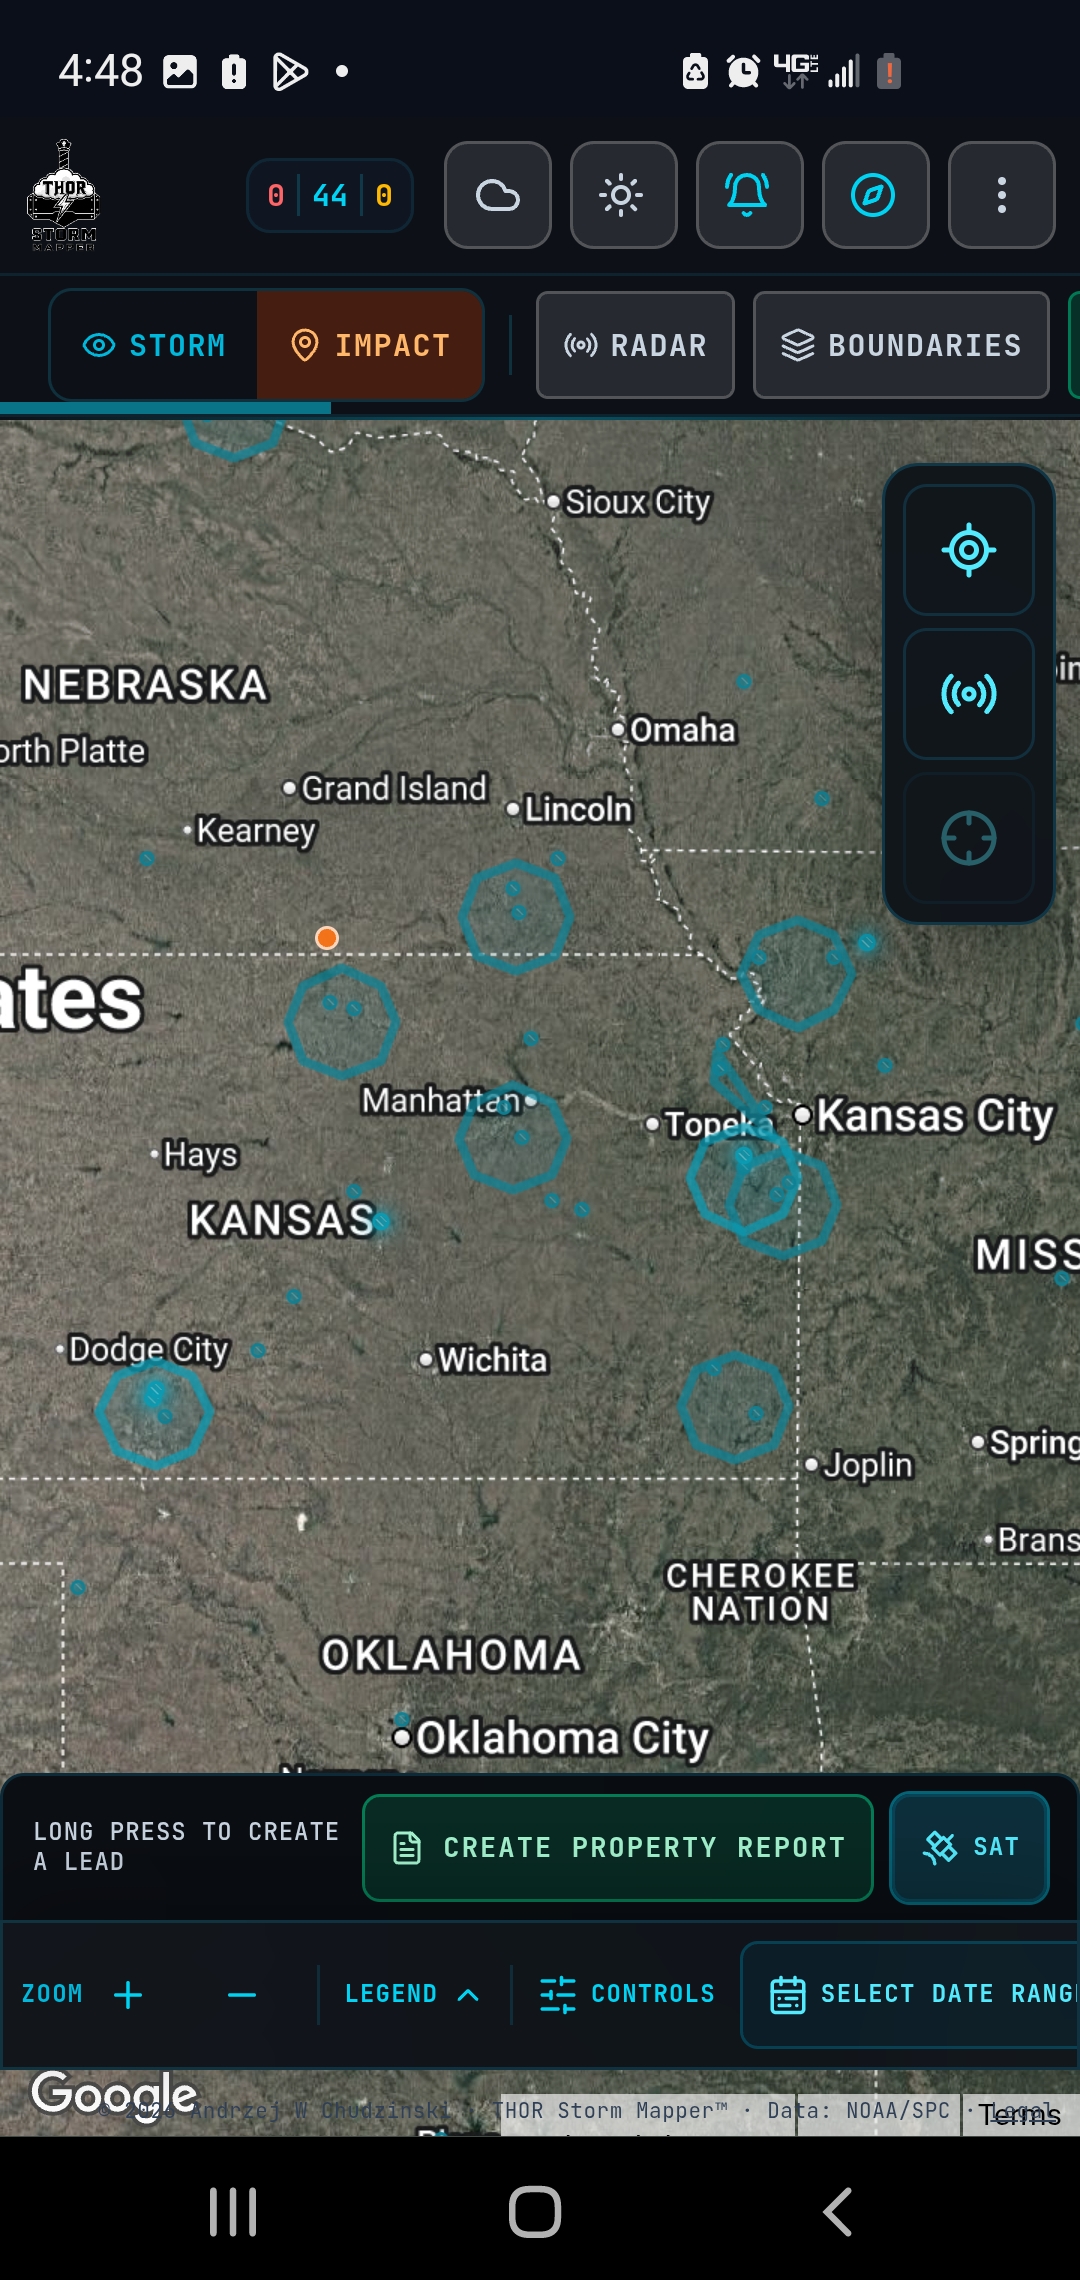
Nationwide Impact Map

Nationwide Impact Map

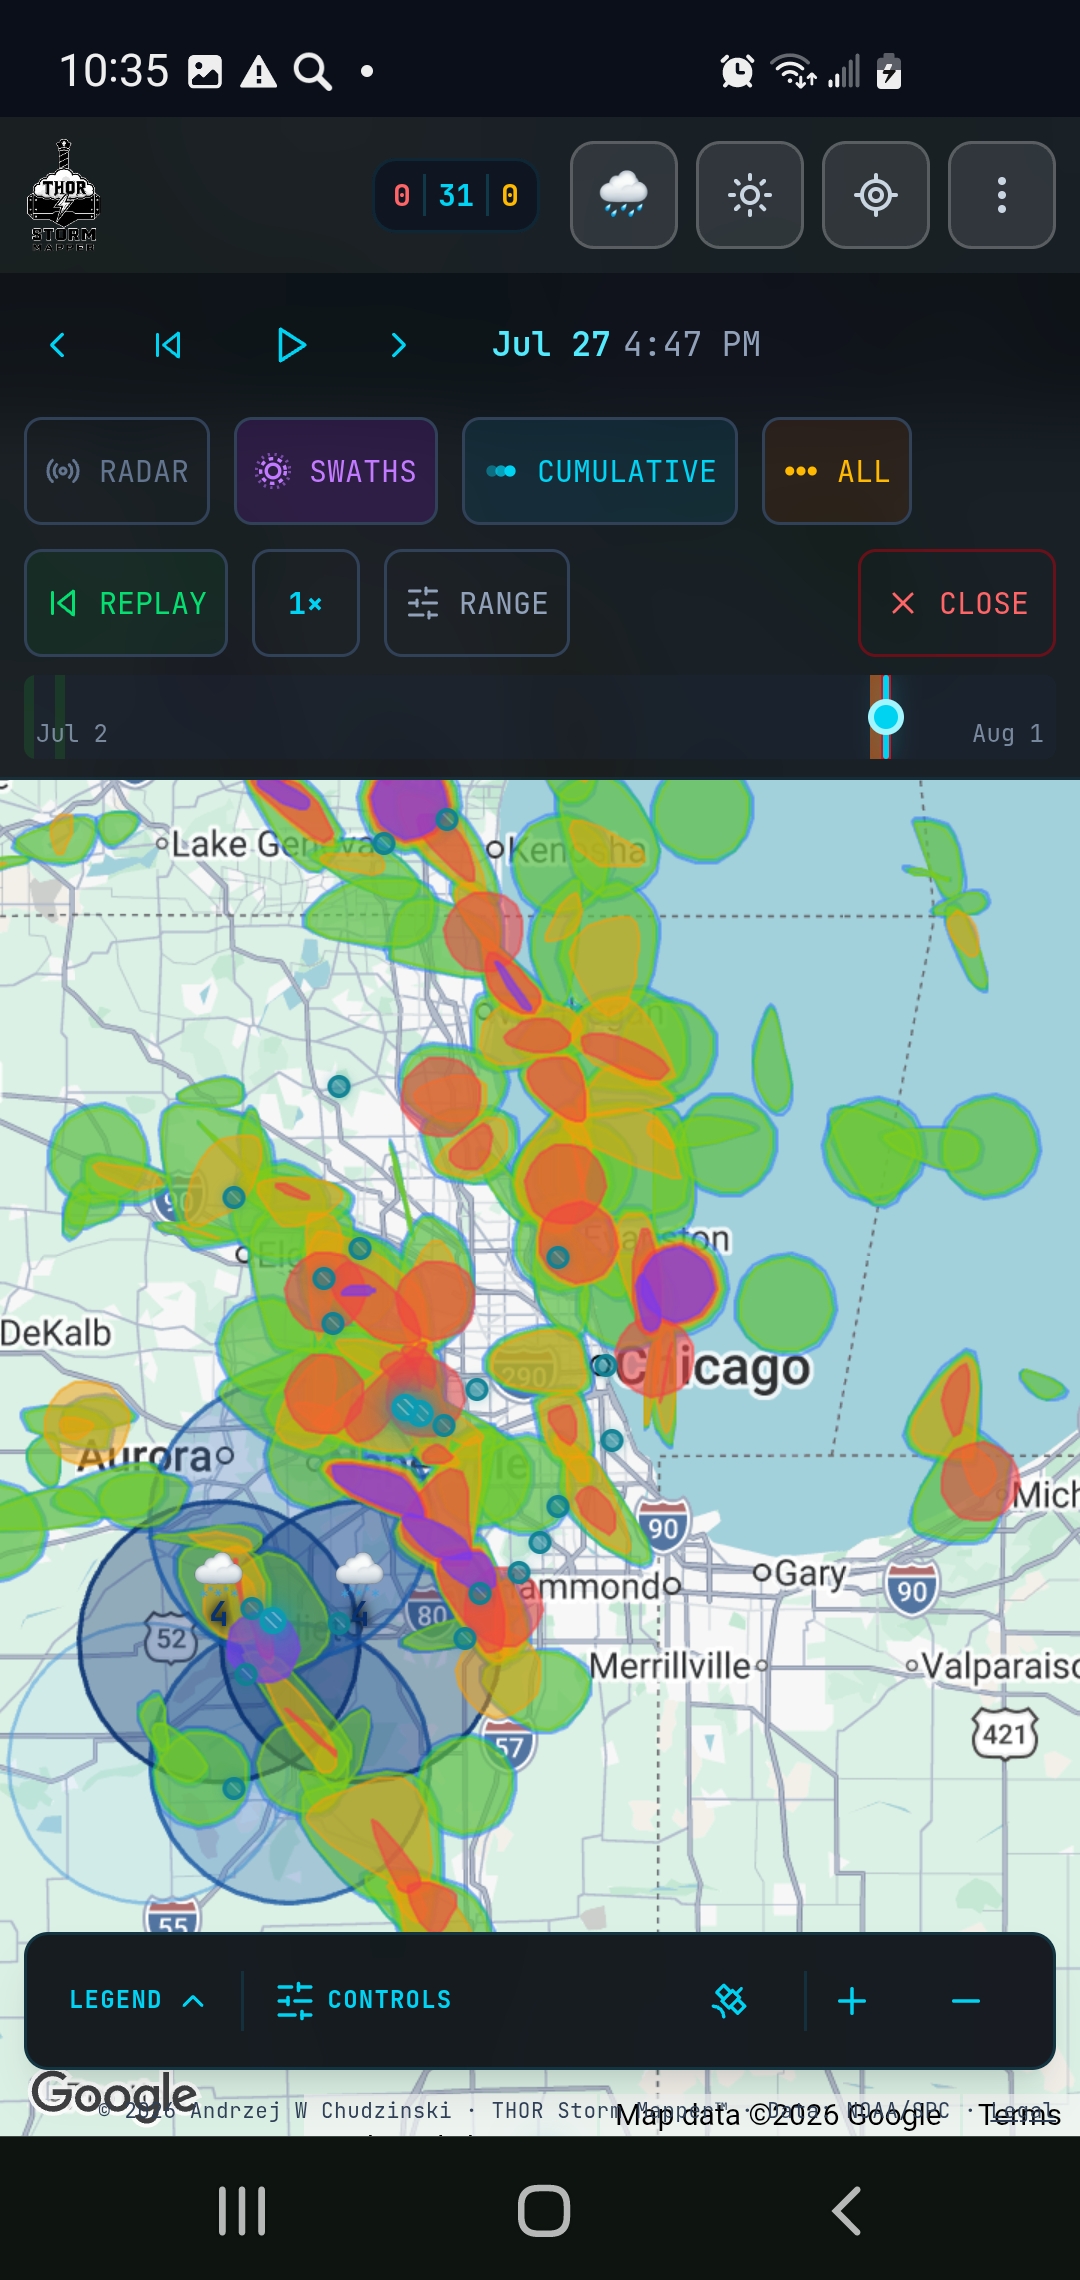
Start wide: see reported storm activity, outbreak clusters, boundaries, and the field controls that keep the map usable from a phone.

Resources for Roofing Contractors

Guides on storm damage leads, hail data, and storm chaser strategy — written for contractors in the field.

Ready to put this into practice?

Start Free Trial →